
Shading Venn Diagrams (1)
Loading the math board and drawing, please wait…
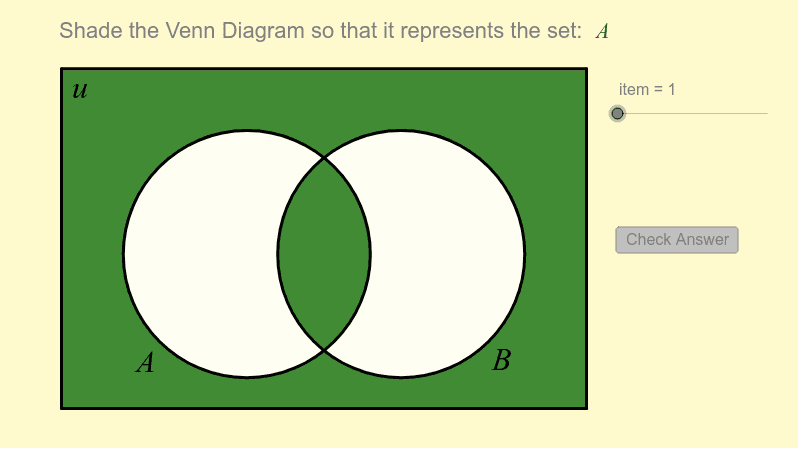
This interactive GeoGebra example is a remake of an earlier Venn diagram shading exercise, designed to help students visualize set operations such as union, intersection, and difference by shading appropriate regions within two overlapping circles (sets A and B) inside a universal set rectangle (U). The core mathematical concepts involve set theory, basic set operations, and the partition of the universal set into distinct regions. The construction uses GeoGebra commands including Segment, Polygon, Corner, If, Element, and Length to build the diagram and control dynamic coloring. The object list includes boolean variables (IsGreen1–IsGreen4) and color components (RB1, G1, etc.) that enable interactive feedback as users select regions to shade. This resource is suitable for middle school through high school mathematics, particularly for teaching set theory, logic, and introductory probability, as it provides a hands-on way to explore how different set operations correspond to visual areas in a Venn diagram.
GeoGebra Commands & Parameters
Segment((x_1, y_1), (x_1, y_2)) → eSegment((x_1, y_2), (x_2, y_2)) → fSegment((x_2, y_1), (x_2, y_2)) → gSegment((x_2, y_1), (x_1, y_1)) → hIf(IsGreen1, 0, 1) → RB1If(IsGreen1, 0.4, 1) → G1If(IsGreen2, 0, 1) → RB2If(IsGreen3, 0, 1) → RB3If(IsGreen4, 0, 1) → RB4If(IsGreen2, 0.4, 1) → G2If(IsGreen3, 0.4, 1) → G3If(IsGreen4, 0.4, 1) → G4Element(problem, item, 1) → textitemLength(problem) → iElement(problem, item, 2) → keyPolygon(Corner[1], Corner[2], Corner[3], Corner[4]) → poly1, l, m, n, qCorner(5) → G
AI Drawing Prompt Reference
Draw a Venn diagram with two overlapping circles representing sets A and B, enclosed by a rectangle representing the universal set U. The rectangle has four sides, and the circles divide the interior into four distinct regions: only A, only B, both A and B, and neither. Each region can be independently shaded, toggling between green (selected) and white (unselected). The diagram should support interactive clicking to change region colors, with a clean layout suitable for teaching set operations.
The prompt above was compiled from the original drawing commands and is for reference only.