
Sequences and Series Demo
Loading the math board and drawing, please wait…
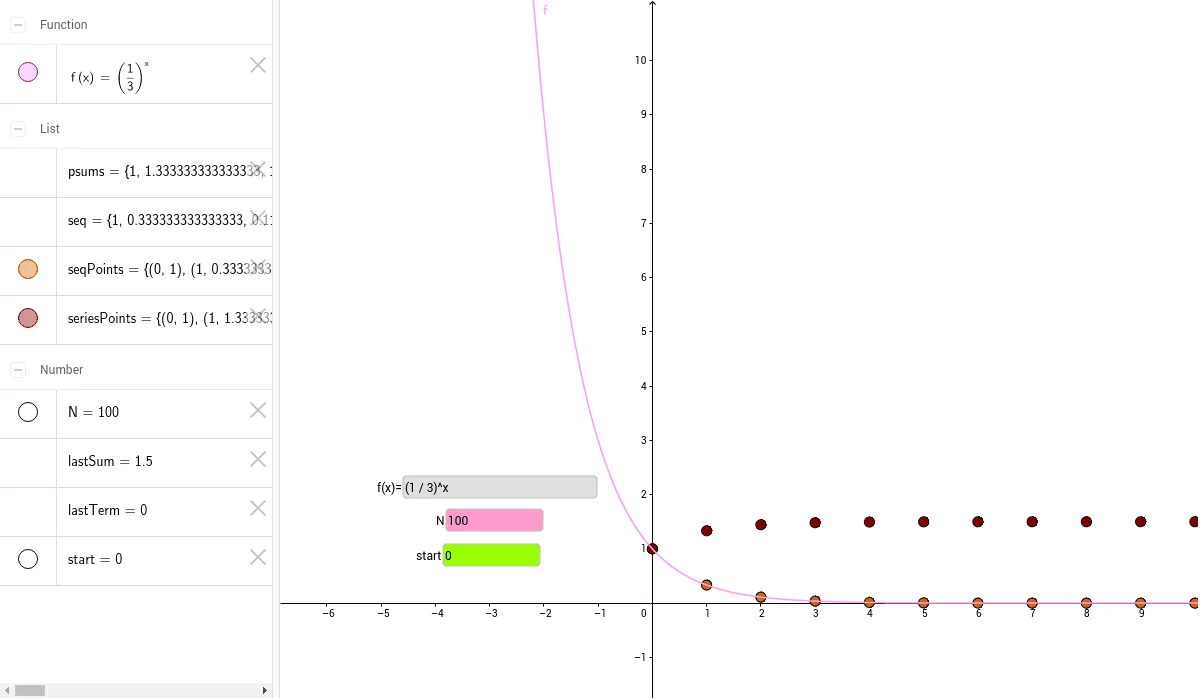
This example demonstrates the graphical representation of sequences and series, dynamically constructing to show the variation patterns of sequence terms and series sums; core mathematical concepts include sequence definition, series summation, coordinate geometry representation, trigonometric function application, and properties of arithmetic and quadratic functions; construction highlights from the summary involve commands like Sequence and Textfield, objects such as f function, start initial value, N term count, seq sequence object, seqPoints sequence points, psums partial sums, lastTerm last term, lastSum last sum, and InputBoxes for input; suitable for high school mathematics teaching to visually aid students in understanding sequence and series concepts and their geometric significance.
GeoGebra Commands & Parameters
Sequence(f(n), n, start, N) → seqSequence((n, f(n)), n, start, N) → seqPointsSequence(Sum[seq, n], n, 1, N - start + 1) → psumsTextfield(start) → InputBox1Textfield(N) → InputBox2Sequence((start + n - 1, psums(n)), n, 1, N - start + 1) → seriesPointsTextfield(f) → InputBox3
AI Drawing Prompt Reference
Create a dynamic visualization of sequences and series. Plot sequence terms as points on a coordinate plane, with the x-axis representing term index and y-axis representing values. Also plot partial sums as points to show cumulative totals. Include three input boxes to adjust the starting index, total number of terms, and the function defining the sequence. The graph should clearly illustrate how both the individual terms and cumulative sums evolve, accommodating functions like trigonometric or quadratic expressions.
The prompt above was compiled from the original drawing commands and is for reference only.