
Sequences and Series Demo by Kenneth
Loading the math board and drawing, please wait…
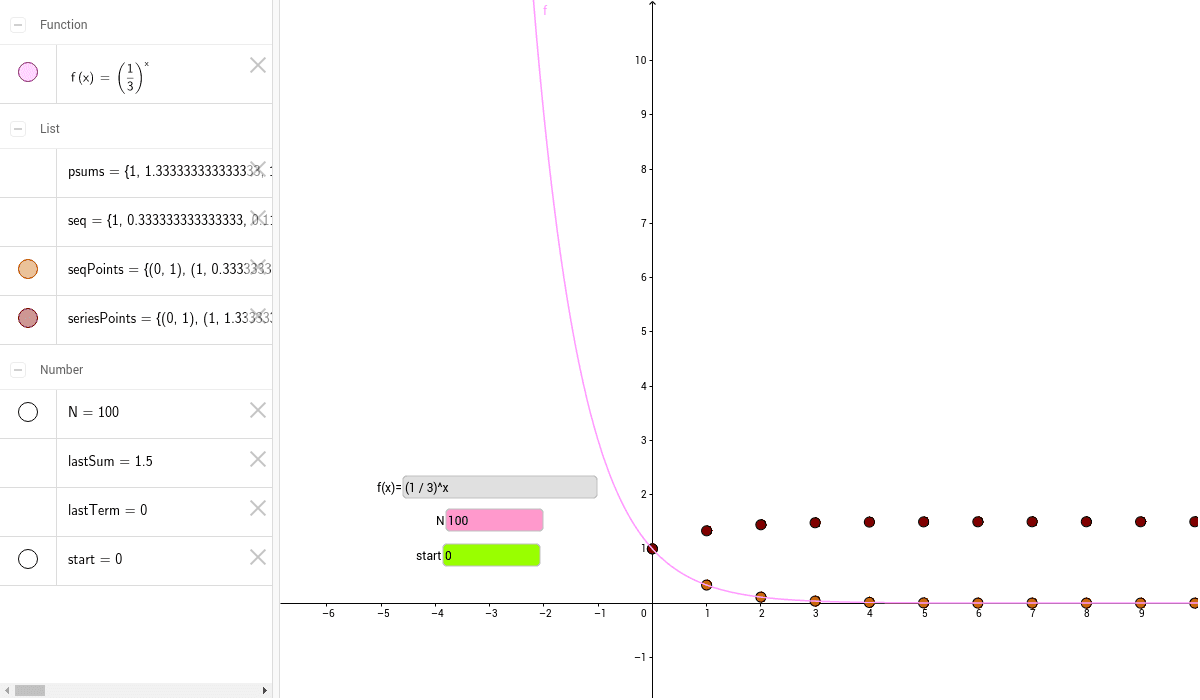
This example demonstrates the generation of sequences and the accumulation of series, visually showing the changes in sequence terms and the growth trend of series sums. Core mathematical concepts include sequences, series, function graphs, and summation. Construction highlights: uses the Sequence command to generate sequences, Textfield for text display, f for functions, start for the starting term, N for term count, seq for sequence points, seqPoints for plotting sequence points, psums for partial sums, lastTerm for the last term, lastSum for the cumulative sum, and InputBoxes for parameter input. Suitable for high school mathematics teaching to understand the basic properties and applications of sequences and series.
GeoGebra Commands & Parameters
Sequence(f(n), n, start, N) → seqSequence((n, f(n)), n, start, N) → seqPointsSequence(Sum[seq, n], n, 1, N - start + 1) → psumsTextfield(start) → InputBox1Textfield(N) → InputBox2Sequence((start + n - 1, psums(n)), n, 1, N - start + 1) → seriesPointsTextfield(f) → InputBox3