
Monte Carlo Pi Estimation with Confidence Interval Visualization
Loading the math board and drawing, please wait…
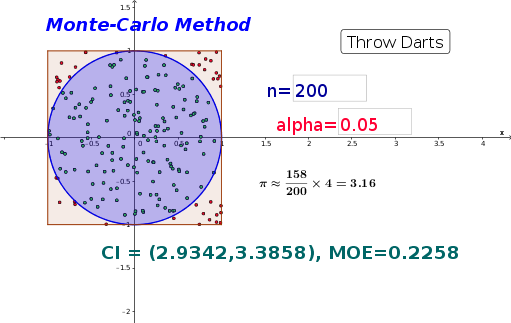
This GeoGebra example demonstrates the Monte Carlo method for estimating π by randomly throwing darts into a square and counting those falling inside an inscribed circle. It visualizes how the estimate converges and displays a confidence interval that narrows as the sample size increases. Core mathematical concepts include geometric probability, the law of large numbers, normal approximation to the binomial distribution, and confidence interval construction. The construction uses commands such as Sequence to generate random points, Sum to count successes, Polygon for the square and circle, Zip and InverseNormal to compute interval bounds, Textfield and inputBox for interactive parameters, and a button to rerun the simulation. Suitable for high school to undergraduate statistics courses, it helps learners grasp the randomness of simulation, the trade-off between accuracy and sample size, and the interpretation of confidence intervals in practice.
GeoGebra Commands & Parameters
Sequence(((2 * random()) - 1, (2 * random()) - 1), k, 1, n) → dartsSum(Zip[f(A), A, darts]) → successPolygon(A, B, C, D) → border, a, b, c, dZip(f(A), A, darts) → junkSequence(If[Element[junk, k], Element[darts, k]], k, 1, n) → list1InverseNormal(phat, sd, (0.5 * alpha)) → cilowInverseNormal(phat, sd, 1 - (0.5 * alpha)) → cihighTextfield(n) → inputBox1Textfield(alpha) → inputBox2
AI Drawing Prompt Reference
Draw a square with an inscribed circle. Scatter many random points inside the square, marking those inside the circle with solid dots and those outside with hollow or lighter dots. Display a live-updating number showing the proportion of points inside the circle, used to estimate pi. Also draw a confidence interval band that narrows as the sample size increases, with upper and lower bounds computed from the current proportion and standard deviation. Provide two input fields to adjust the total number of points and the confidence level, plus a button to rerun the random simulation. Keep the layout clear, emphasizing the randomness and the convergence of the interval.
The prompt above was compiled from the original drawing commands and is for reference only.