
Sequence Term and Graphing Example
Loading the math board and drawing, please wait…
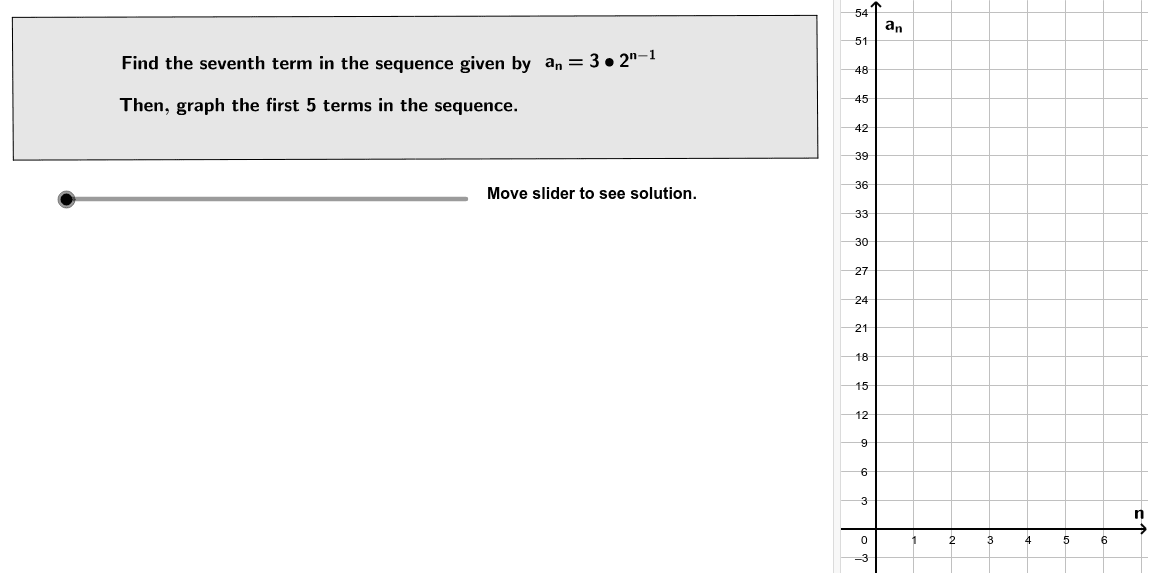
This example demonstrates how to find a specific term in a sequence and graph the first five terms. Core math concepts include sequence term calculation and function graphing. GeoGebra commands used are Polygon, and objects like ProbState, Sub7, Form1, poly1, a, b, c, d, a7Equals, n, Instructions, Generate5, Form2, a1, a3, a4, a5, a2, asubn, N, Form0, nasubn, DescribePairs1, CreateP1, OP1, OP2, OP3, OP4, OP5, A1, A2, A3, A4, A5, PlotPoints, text1. Suitable for high school mathematics education, focusing on sequence and function graphing practice.
GeoGebra Commands & Parameters
Polygon((-4.022, 6.484), (13.678, 6.528), (13.7, 3.388), (-4, 3.344)) → poly1, a, b, c, d
AI Drawing Prompt Reference
Draw the first five terms of a sequence and plot their coordinates. First, draw a quadrilateral with vertices at (-4.022, 6.484), (13.678, 6.528), (13.7, 3.388), and (-4, 3.344). Then, calculate the first five terms of the sequence and plot these points on the coordinate plane.
The prompt above was compiled from the original drawing commands and is for reference only.