
Self Discovery of Graph Transformations
Loading the math board and drawing, please wait…
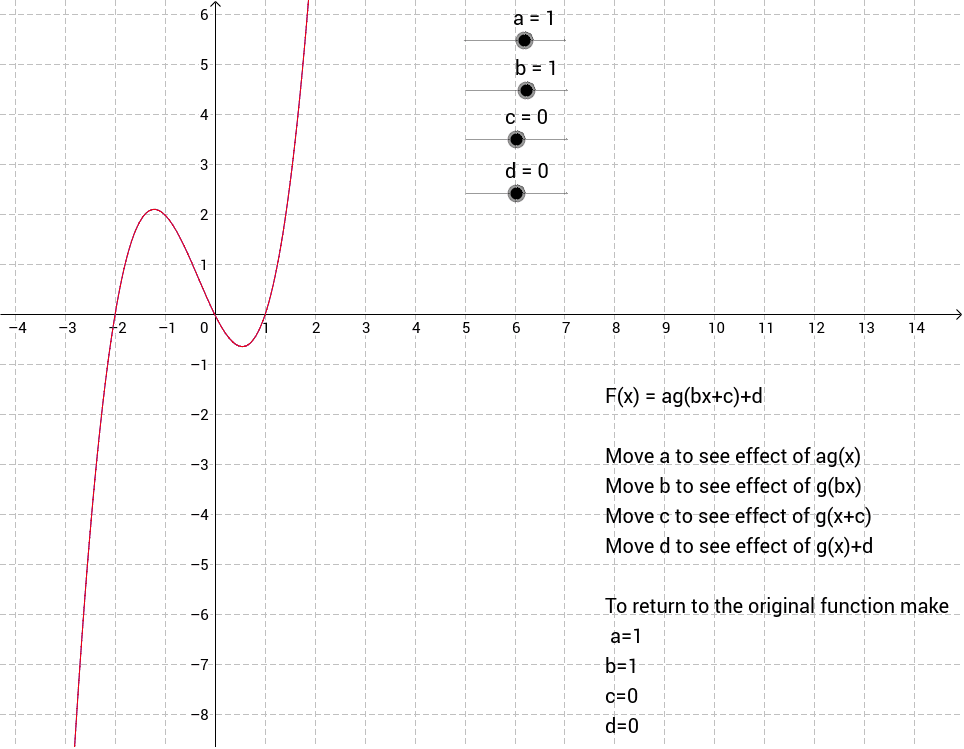
This example demonstrates the dynamic changes of function graphs under various parameter transformations. The core math concepts involved include function graphs, geometric transformations, trigonometry, frequency distribution, ratios, and polynomial functions. It is constructed using GeoGebra commands like objects g, a, b, c, d, F, text1, which are used to build and display function graphs and their transformations. Suitable for high school students to learn and understand the rules of function transformations, or for teacher demonstrations.
GeoGebra Commands & Parameters
g(x) = (x - 1) * (x + 2) * xNumeric a(1)Numeric b(1)Numeric c(0)Numeric d(0)F(x) = a * g(b * x + c) + d
AI Drawing Prompt Reference
Draw the graph of a basic polynomial function and show its dynamic transformations through parameter changes. First, plot the original function graph, then display its horizontally stretched, horizontally shifted, vertically shifted, and vertically scaled versions based on parameters a, b, c, d, and label these parameters and their effects on the function graph, suitable for students to understand function transformation rules.
The prompt above was compiled from the original drawing commands and is for reference only.