
Secant Line Activity on a Parabola
Loading the math board and drawing, please wait…
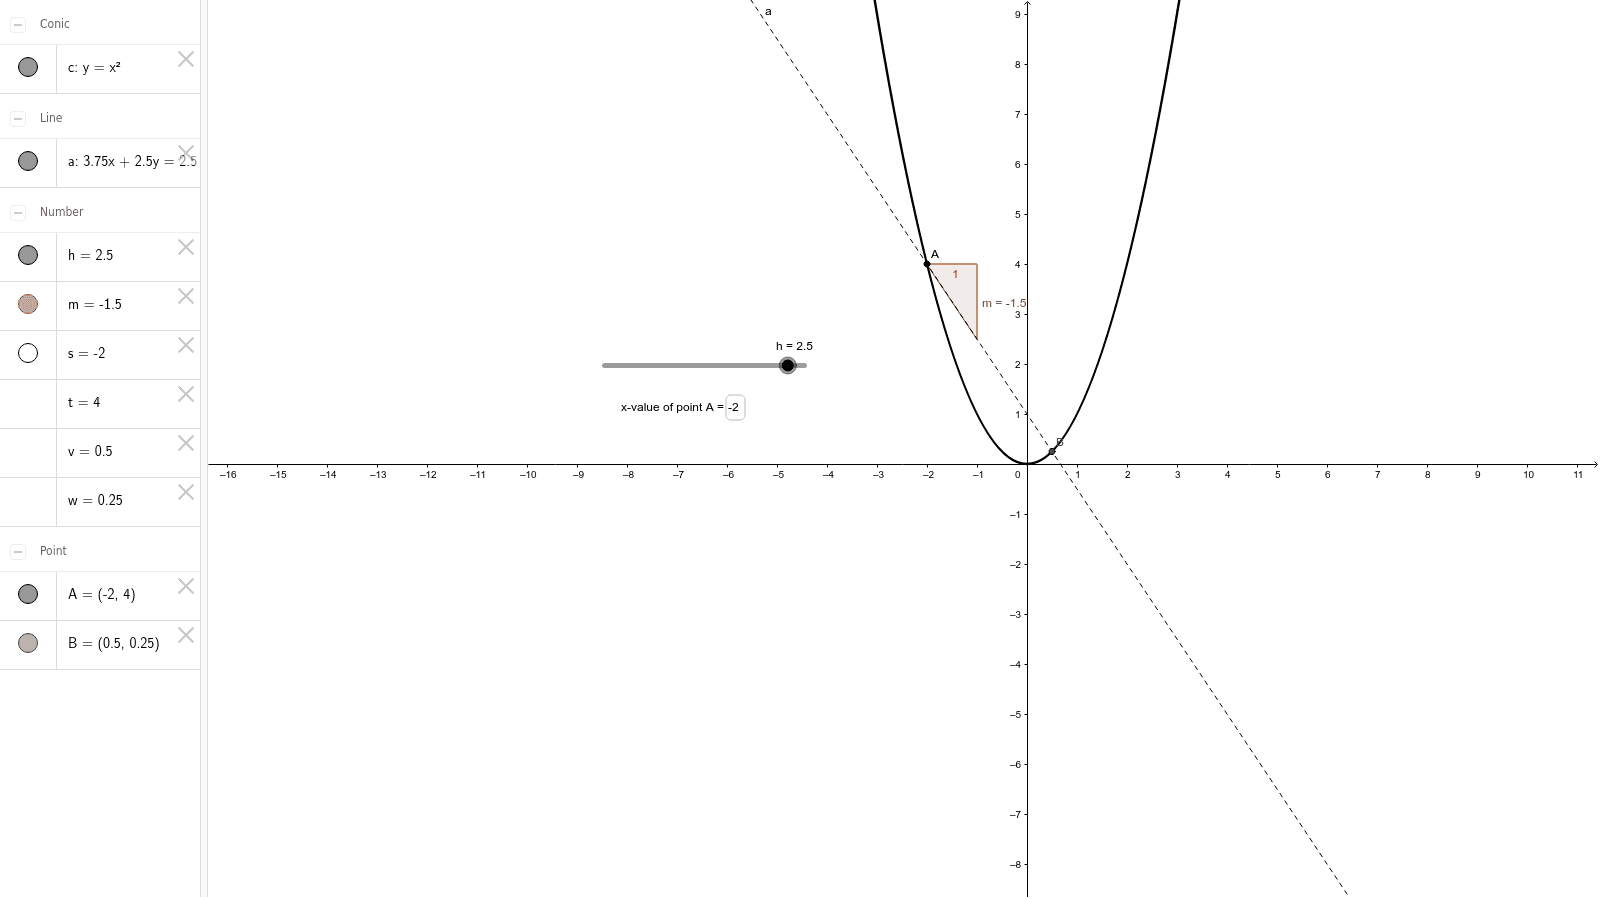
This GeoGebra example demonstrates a secant line drawn through two points on a parabola, dynamically showing how the secant slope changes as the points move and illustrating the limiting relationship between secants and tangents. Core mathematical concepts include parabolas, quadratic functions, coordinate geometry, secant slope computation, and the geometric meaning of the derivative as the limit of secant slopes. Construction highlights, drawn from the provided command summary, involve GeoGebra commands Textfield, Line, and Slope, together with objects c, s, inputBox1, t, A, h, v, w, B, a, m; points A and B determine the secant’s intersections, parameter h controls horizontal shift, inputBox1 and t enable interactive input, line c represents the secant, and slope s displays its inclination in real time. The resource is suitable for high school mathematics covering functions and derivatives, as well as introductory university calculus visualization, classroom inquiry, and independent student exploration.
GeoGebra Commands & Parameters
Textfield(s) → inputBox1Line(A, B) → aSlope(a) → m
AI Drawing Prompt Reference
Draw a parabola and place two movable points on it. Connect these points with a straight line to form a secant. Include an input box that allows adjusting the horizontal position of one point, thereby changing the secant's slope. Display the slope value of the secant, updating in real time as the points move. Show how the secant slope changes with point positions, illustrating the geometric relationship where the secant approaches a tangent.
The prompt above was compiled from the original drawing commands and is for reference only.