
Scatter Plot Investigation: Median, Mean, and Function Fitting
Loading the math board and drawing, please wait…
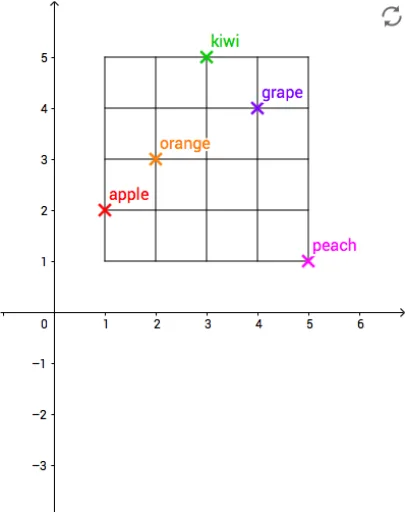
① This GeoGebra example presents an interactive scatter plot that demonstrates the relationship between data point distribution and statistical measures (median, mean) as well as function fitting. ② Core mathematical concepts include scatter plots, correlation, median, mean, trigonometric functions, spheres (possibly for 3D data visualization), and function modeling. ③ Construction details: The commands Sequence, Point, and Sum are used to generate data point sequences, along with grid, horizontal lines (hlines), and vertical lines (vlines) for visual reference; objects include points A through E and their variants (A1-A6, B2-B6, etc.) to represent different data subsets or statistical markers. ④ Suitable for middle school to university-level statistics and function teaching, this example aids in exploring data distribution, central tendency measures, and intuitive understanding of function fitting, and can serve as a teacher demonstration or student self-exploration material.
GeoGebra Commands & Parameters
Sequence(Sequence[(a, b), a, 1, 5], b, 1, 5) → gridPoint(grid) → APoint(grid) → BPoint(grid) → CPoint(grid) → DPoint(grid) → ESequence(Segment[(1, a), (5, a)], a, 1, 5) → hlinesSequence(Segment[(a, 1), (a, 5)], a, 1, 5) → vlinesSum(E2:E6) → E8
AI Drawing Prompt Reference
Create an interactive scatter plot showing the relationship between data point distribution, statistical measures (median, mean), and function fitting. Include a grid, horizontal and vertical lines for reference, generate multiple data points using sequences, and represent different subsets or statistical markers with these points.
The prompt above was compiled from the original drawing commands and is for reference only.