
Linear Regression Using Average Point
Loading the math board and drawing, please wait…
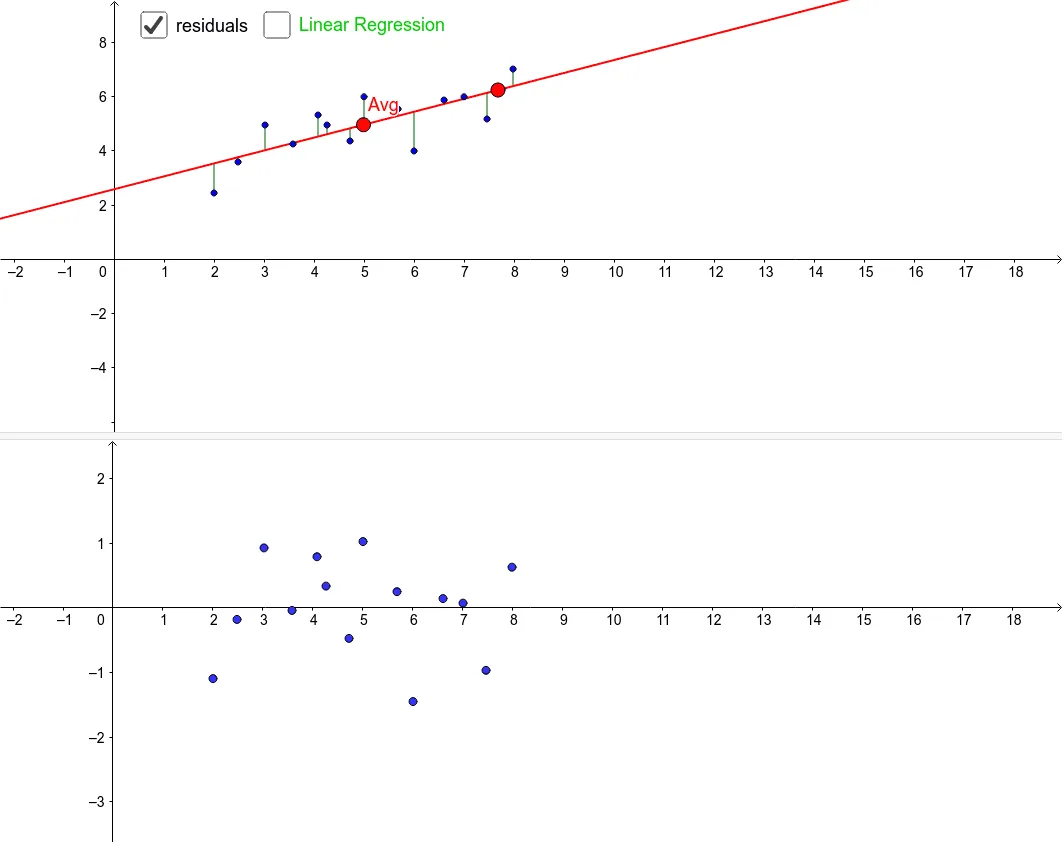
① This example demonstrates how to fit a linear regression line using the average point of a data set, showing the relationship between the regression line and the data points. ② Core mathematical concepts include linear regression, mean, least squares idea, slope and intercept, residual sum of squares, and other statistical characteristics. ③ Construction highlights: using GeoGebra commands such as Sequence to generate a list of data points (list1), mean to compute the average x and y values forming the average point (Avg), Line, Slope, and FitLineY to construct the regression line (LR), and calculating related statistics (e.g., residual sum of squares sR, coefficient of determination). Auxiliary points like P, Yp, Pp are also displayed. ④ Suitable for high school or college statistics courses to intuitively understand the geometric meaning of linear regression and the role of the average point, as well as for exploring basic data fitting concepts.
GeoGebra Commands & Parameters
Sequence(y(Element[list1, k]), k, 1, 14) → Ymean(Y) → y_{avg}Sequence(x(Element[list1, k]), k, 1, 14) → Xmean(X) → x_{avg}Line(Avg, P) → aSlope(a) → mSequence(b + (m * x(Element[list1, k])), k, 1, 14) → YpSequence((Element[X, k], Element[Yp, k]), k, 1, 14) → PpSequence(Segment[Element[list1, k], Element[Pp, k]], k, 1, 14) → RsSequence((Element[X, k], Element[Y, k] - Element[Yp, k]), k, 1, 14) → RpFitLineY(list1) → LR
AI Drawing Prompt Reference
Create a scatter plot with fourteen data points. Compute the average x and y coordinates to form an average point. Draw a line connecting the average point to one of the data points, and determine its slope. Using this slope, calculate predicted y-values for each data point, generating predicted points. Connect each original data point to its predicted point with a segment to show residuals. Also, draw a best-fit regression line passing through the average point, and display relevant statistics.
The prompt above was compiled from the original drawing commands and is for reference only.