
Scatter Plot and Linear Regression
Loading the math board and drawing, please wait…
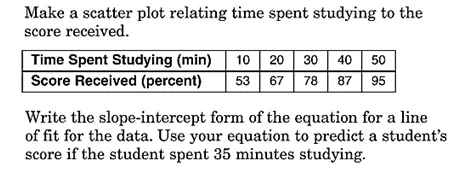
This example demonstrates how to use a scatter plot to show the linear relationship between data points and how to fit a line using linear regression analysis. Key mathematical concepts include linear regression and scatter plots. It utilizes commands such as FitLineY, Intersect, Slope, Point, Line, Segment, mean, TableText, PMCC, etc., in GeoGebra. Suitable for high school mathematics education and learning linear regression analysis.
GeoGebra Commands & Parameters
FitLineY({A, B, C, D, E}) → aIntersect(yAxis, a) → GSlope(a) → mPoint(a) → JPoint(a) → KLine(J, xAxis) → bLine(K, yAxis) → cIntersect(b, c) → LSegment(J, L) → dSegment(L, K) → emean(B2:B6) → y_mmean(B7:B7) → gTableText({{A1, B1, C1, D1, E1, F1, G1}, {A2, B2, C2, D2, E2, F2, G2}, {A3, B3, C3, D3, E3, F3, G3}, {A4, B4, C4, D4, E4, F4, G4}, {A5, B5, C5, D5, E5, F5, G5}, {A6, B6, C6, D6, E6, F6, G6}, {A7, B7, C7, D7, E7, F7, G7}}, "|_") → text12PMCC({A, B, C, D, E}) → h
AI Drawing Prompt Reference
Create a scatter plot with five data points and add a linear regression line fitted through them. Mark the intersection of this line with the y-axis and display the slope of the line. Pick two arbitrary points on the line, draw perpendiculars from each to the x-axis and y-axis respectively, and mark their intersection. Connect this intersection to the two perpendicular feet with segments, forming a right triangle. Also, present a table listing all data point coordinates and compute the mean of the y-values. Finally, show the Pearson correlation coefficient to indicate the strength of the linear relationship.
The prompt above was compiled from the original drawing commands and is for reference only.