
Scatter Plot and Correlation
Loading the math board and drawing, please wait…
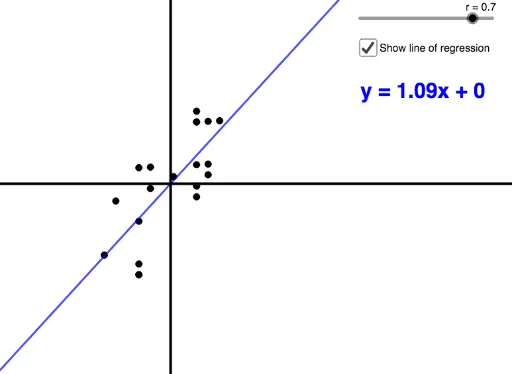
This example demonstrates how to dynamically generate a scatter plot by manipulating the correlation coefficient between two variables. Key math concepts include correlation coefficient, scatter plot, mean, and standard deviation. It utilizes GeoGebra commands like Sequence, SD, Mean, If, and objects such as r, a, A, Y, sdy, meany, X, sdx, meanx, B, C, h, i, Xnorm, Ynorm, Z, L1, Points, f, L_1, b, text1 for data generation and graphical construction. Suitable for high school students learning statistics and data analysis.
GeoGebra Commands & Parameters
Sequence(Random[0, 10], n, 1, 20) → YSD(Y) → sdyMean(Y) → meanySequence(Random[0, 10], n, 1, 20) → XSD(X) → sdxMean(X) → meanxSequence((X(n) - meanx) / sdx, n, 1, 20) → XnormSequence((Y(n) - meany) / sdy, n, 1, 20) → YnormSequence((Xnorm(n), Z(n)), n, 1, 20) → PointsIf(r ≠ 1 ∧ r ≠ -1, FitPoly[Points, 1], If[r ≟ 1, (3 * x), (-3 * x)]) → fSequence(If[r ≟ 1, (n, (3 * n)), (n, (-3 * n))], n, -3, 3, 0.3) → L_1