
Scale Drawings and Maps Practice
Loading the math board and drawing, please wait…
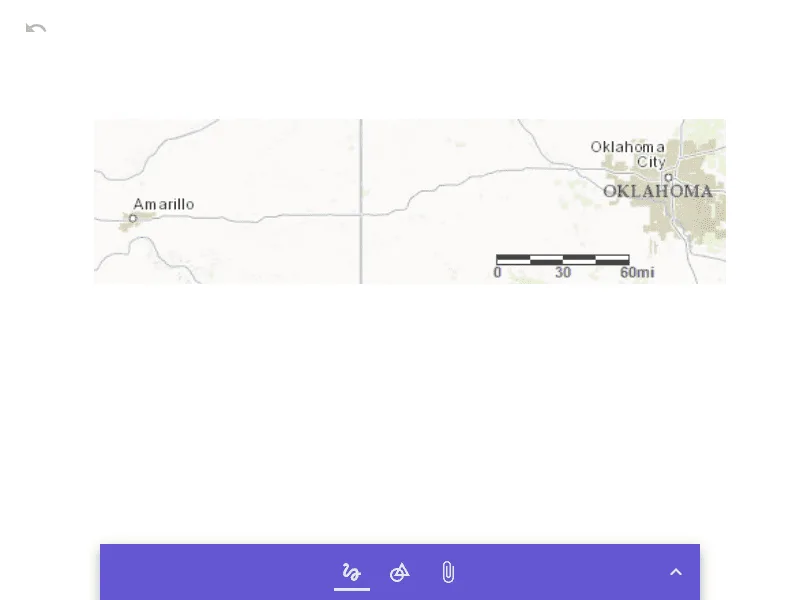
This example demonstrates the application of scale drawings in maps, showing the relationship between actual distances and map distances through scaling. Core math concepts include ratios, similar figures, measurement, and conversion. It uses the GeoGebra object 'pic1' to illustrate the correspondence between scale and actual distance. Suitable for middle school students to learn the basic principles of scale drawings, applicable in geography and measurement contexts.
AI Drawing Prompt Reference
Create a diagram illustrating the use of scale in maps, showing the relationship between actual distances and map distances through scaled figures, emphasizing concepts like ratios, similar shapes, measurement, and unit conversion. Include a larger figure representing an actual area and a smaller, scaled figure representing a map, with labels indicating the scale factor between them to demonstrate the correspondence of distances.
The prompt above was compiled from the original drawing commands and is for reference only.