
Sail Boat 1: Exploring Periodic Functions
Loading the math board and drawing, please wait…
In collections
Sail Away!
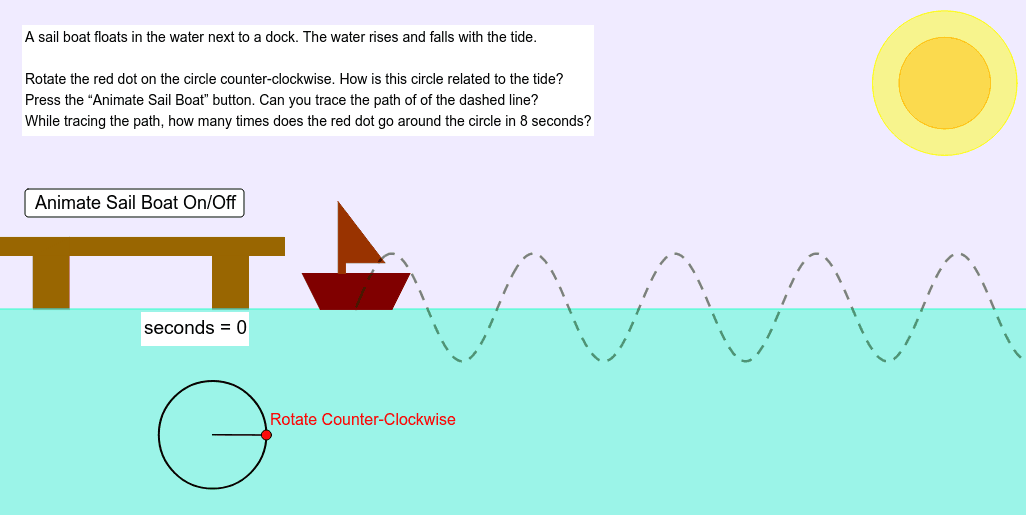
This worksheet uses a sail boat next to a dock to help students develop intuition about periodic functions. The GeoGebra construction employs circles, points, segments, polygons, and intersections to model a wave (wavetop) and the boat's components, incorporating 2D vectors, angles, arithmetic mean, and inequalities. Interactive sliders and animation allow learners to raise and lower the sail, visualizing amplitude and period. Designed for middle and high school students, it supports lessons on trigonometry, function graphing, and geometric modeling.
GeoGebra Commands & Parameters
Circle(A, B) → cPoint(c) → CSegment(D, C) → gSegment(C, A) → hPolygon(E, F, G, H) → poly1, e, f_1, g_1, h_1Point(g_1) → IPolygon(I, J, K, L) → poly2, i, j, k, lIntersect(g_1, yAxis) → MPoint(g_1) → PPolygon(M, N, O, P) → poly3, m, n, o, pPolygon(T, S, Q, R) → poly4, t, s, q, rPolygon(U, W, Z, A_1, V) → poly5, b, d, i_1, j_1, k_1Circle(B_1, C_1) → c_1Circle(B_1, D_1) → d_1
AI Drawing Prompt Reference
Draw a sailboat next to a dock to illustrate periodic functions. The figure includes a dock, a wave line, a sailboat, and its hull. The wave line is made of multiple arcs, and the sail can be raised or lowered to show amplitude and period. The construction order: first draw the dock and wave line, then add the sailboat and hull, and finally adjust the sail to visualize amplitude and period.
The prompt above was compiled from the original drawing commands and is for reference only.