
Saha & Boltzmann Equation Calculators and Graphs
Loading the math board and drawing, please wait…
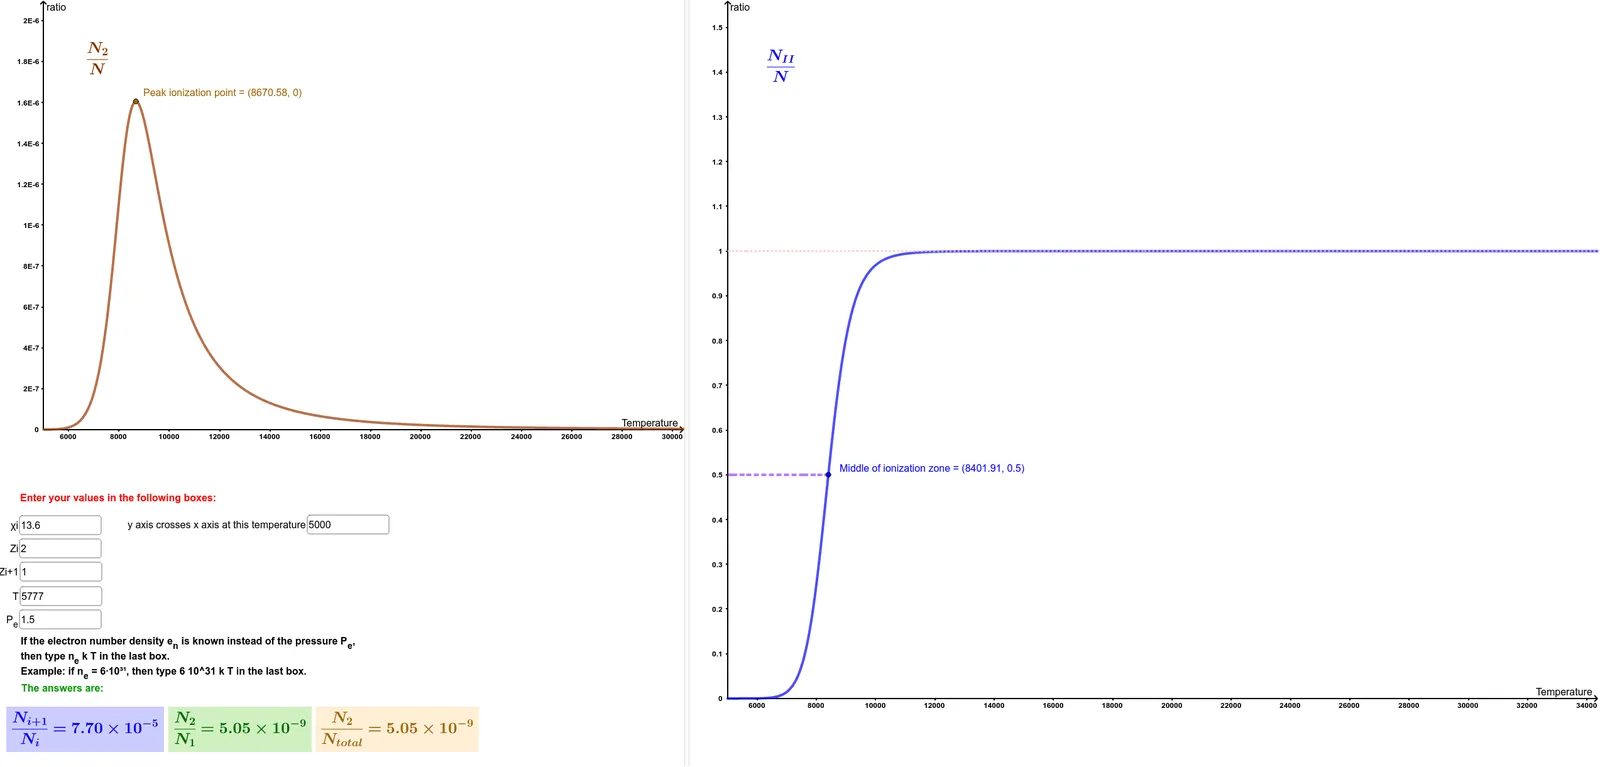
This example demonstrates the calculation and graph plotting of the Saha and Boltzmann equations. Key math concepts include Probability & Statistics, Derivative, Natural Numbers, Coordinate Geometry. It uses GeoGebra commands like ScientificText, Textfield, Intersect, Extremum with objects such as tplot, E, Z_1, Z_2. Suitable for high school students and math enthusiasts learning graphical representation and computation of these equations.
GeoGebra Commands & Parameters
ScientificText(R_o, 3) → SolarMassScientificText(AU, 2) → text2ScientificText(G, 3) → text3ScientificText(M_o, 3) → text4ScientificText(c, 3) → text5ScientificText(ly, 3) → text6ScientificText(pc, 3) → text8ScientificText(siny, 3) → text7Textfield(lys_1) → InputBox1Textfield(pcs_2) → InputBox2ScientificText(m_H, 3) → text11ScientificText(k, 3) → text12ScientificText(eV, 3) → text13ScientificText(m_e, 3) → text14ScientificText(h, 3) → text15ScientificText(answ, 3) → text16Textfield(E) → InputBox3Textfield(Z_1) → InputBox4Textfield(T) → InputBox6Textfield(Z_2) → InputBox5Textfield(P) → InputBox7Intersect(half, g, (8401.90763534541, 0.5)) → AScientificText(N2N1, 3) → text21Textfield(E) → InputBox3_1Textfield(Z_1) → InputBox4_1Textfield(T) → InputBox6_1Textfield(Z_2) → InputBox5_1Textfield(P) → InputBox7_1Textfield(E) → InputBox3_2Textfield(Z_1) → InputBox4_2Textfield(T) → InputBox6_2Textfield(Z_2) → InputBox5_2Textfield(P) → InputBox7_2ScientificText(N2NT, 3) → text17Textfield(tplot) → InputBox8Extremum(Bol) → B