
Rotation by Distance: Cylinder with Random Variables and Boxplot
Loading the math board and drawing, please wait…
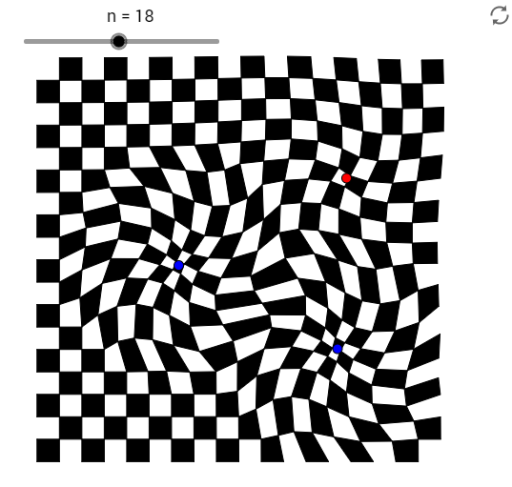
This example demonstrates a dynamic geometry construction combining rotation, a cylinder, random variables, and a boxplot. It uses a slider to control the rotation angle, causing points on the cylinder to rotate based on their distance parameter, while simultaneously generating random sequences and plotting a boxplot to show the link between geometric transformations and statistical distributions. Core mathematical concepts include rotation, cylinder, random variables, geometric mean, and boxplot. Construction highlights: using GeoGebra commands Point, If, and Sequence to create point lists and conditional logic; defining objects tk, n, C, ak, k, cf, a, b, d, h, A, G, F, g, f, liste1, liste3, B, liste2, listeM, and listePoly. Sequence generates random data, If filters conditions, Point marks key locations, and list objects are used to render the boxplot and cylinder. Suitable for high school or early college students to understand the integration of geometric transformations and statistical charts, and useful for math lab activities or inquiry-based learning.
GeoGebra Commands & Parameters
Point(y = 0) → GIf(cf, h, g) → fSequence(Sequence[Rotate[(i, j), g(Distance[A, (i, j)]), A], i, 0, n], j, 0, n) → liste1Sequence(Sequence[Rotate[(i, j), k(Distance[C, (i, j)]), C], i, 0, n], j, 0, n) → liste3Sequence(Sequence[Rotate[(i, j), f(Distance[B, (i, j)]), B], i, 0, n], j, 0, n) → liste2Sequence(Sequence[(Element[liste1, j, i] + Element[liste2, j, i] + Element[liste3, j, i]) / 3, i, 1, n + 1], j, 1, n + 1) → listeMSequence(Sequence[Polygon[Element[listeM, j, i], Element[listeM, j, i + 1], Element[listeM, j + 1, i + 1], Element[listeM, j + 1, i]], i, 1.5 + (-1)^(j) / 2, n, 2], j, 1, n) → listePoly
AI Drawing Prompt Reference
Draw a cylinder and use a slider to control the rotation angle, causing points on the cylinder to rotate based on their distance parameter. Simultaneously generate a sequence of random numbers and plot a boxplot to show the relationship between geometric transformations and statistical distributions. First, create the cylinder, then use the rotation command to rotate points based on distance parameters, generating three point sequences, and finally calculate the average of these sequences to draw the cylinder's polygons.
The prompt above was compiled from the original drawing commands and is for reference only.