
Rotation and Function Graph Demonstration
Loading the math board and drawing, please wait…
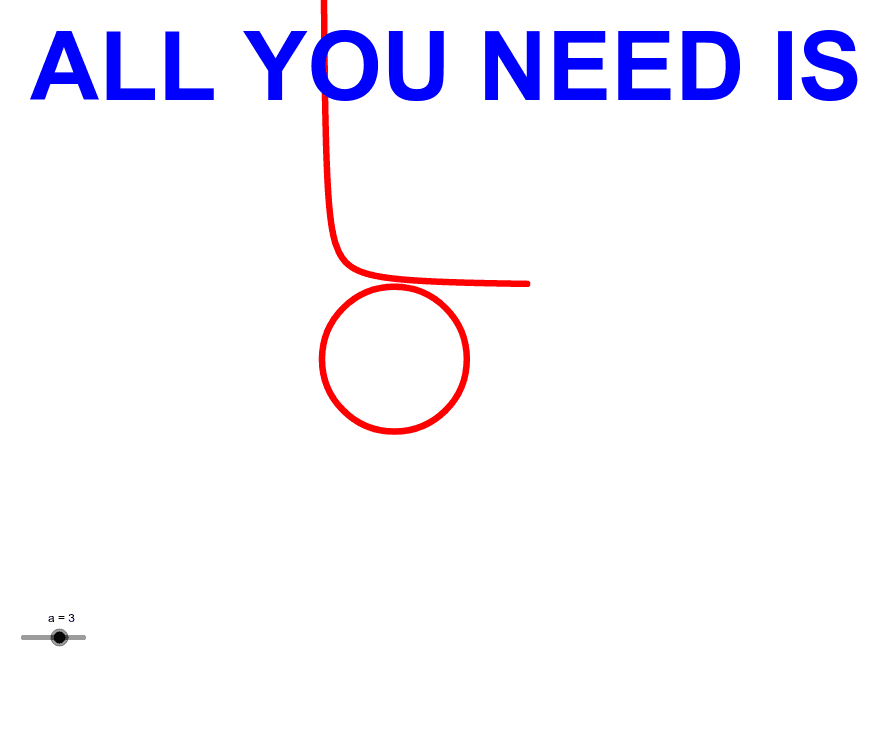
This example demonstrates the process of generating new geometric shapes by rotating function graphs. The core mathematical concepts involved include functions, rotation, coordinate geometry, and probability & statistics. The construction highlights the use of the Rotate command on objects f, c, g, h, q, A, B, q_1, text1, a. It is suitable for high school and above students learning about function transformations, geometric constructions, and probability & statistics.
GeoGebra Commands & Parameters
Rotate(q, (-(90°)), B) → q_1
AI Drawing Prompt Reference
Draw a function graph and rotate it 90 degrees counterclockwise around point B to generate a new function graph. First, draw the function graph q, then rotate q around point B to create the rotated function graph q_1.
The prompt above was compiled from the original drawing commands and is for reference only.