
Roots of a Parabola: Interactive Exploration
Loading the math board and drawing, please wait…
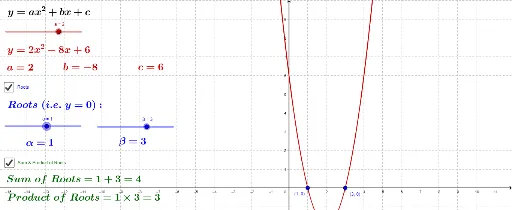
① This GeoGebra example dynamically visualizes the roots (x-intercepts) of a parabola y = ax² + bx + c as the coefficients change, helping learners understand the relationship between quadratic equations and their graphs. ② Core mathematical concepts include quadratic functions, roots/zeros of a parabola, the discriminant, intersections with the x-axis, and how parameter variations affect the solutions. ③ Construction highlights: the Intersect command is used to find the parabola's intersection points with the x-axis; sliders (a, b, c) control the coefficients; text objects (text1 through text10) dynamically display root values and discriminant information; involved objects include the curve, points A and B, and auxiliary elements α, β, s, p, o, r. ④ Suitable for middle and high school students learning quadratic functions and equations, as well as for classroom demonstrations or self-study, allowing users to adjust coefficients and observe how roots change, deepening understanding of the discriminant and root properties.
GeoGebra Commands & Parameters
Intersect(curve, xAxis, 2) → AIntersect(curve, xAxis, 1) → B
AI Drawing Prompt Reference
Draw a parabola y=ax²+bx+c where a, b, and c are adjustable by sliders. Change the values of a, b, and c using sliders and observe how the parabola intersects the x-axis. Dynamically show the coordinates of the intersection points and display the root values and discriminant information in text boxes.
The prompt above was compiled from the original drawing commands and is for reference only.