
Riemann Sum Rectangles for Integral Approximation
Loading the math board and drawing, please wait…
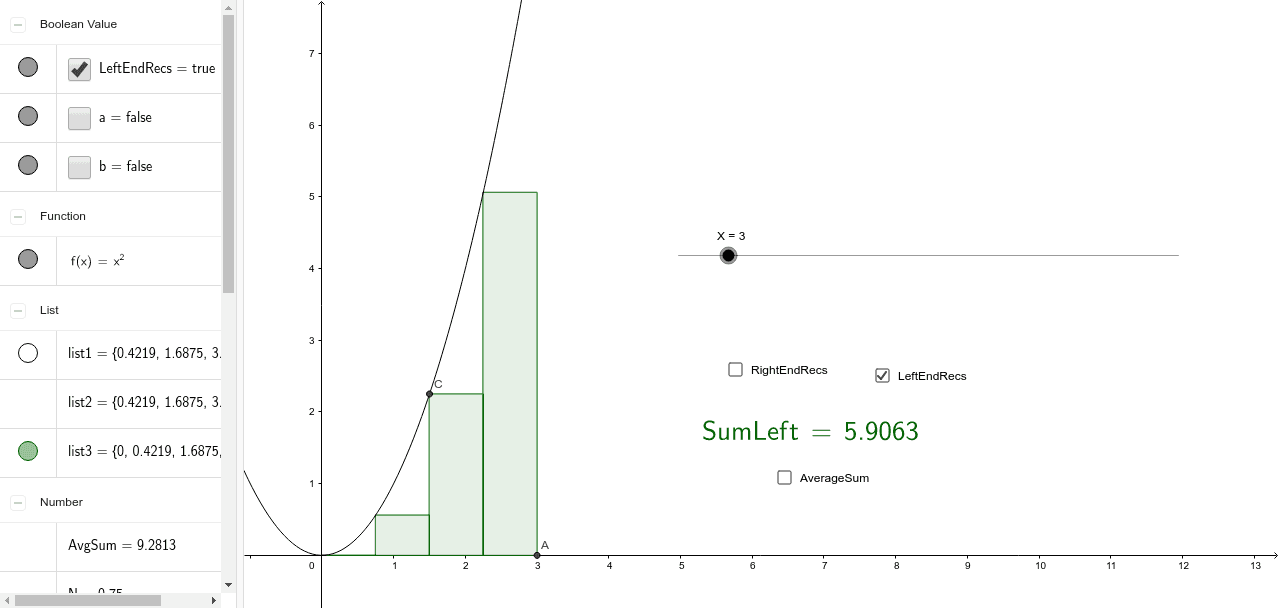
This example demonstrates using Riemann sum rectangles (left, right, and midpoint) to approximate the definite integral, i.e., the area under a curve. By adjusting the number of rectangles N, users can observe how the sum of rectangle areas approaches the actual integral value. Core mathematical concepts include Riemann sums, the definition of definite integrals, and limits. Construction highlights: Sequence command generates equally spaced partition points, Sum command calculates rectangle areas, function f defines the curve, inequalities set integration bounds [a,b], and slider N controls rectangle count. Suitable for high school calculus or college introductory mathematics, helping students intuitively understand integrals as limits.
GeoGebra Commands & Parameters
Sequence(Polygon[(i, 0), (i + N, 0), (i + N, f(i + N)), (i, f(i + N))], i, 0, X - N, N) → list1Sequence((N * f(i)), i, N, X, N) → list2Sum(list2) → SumRightLaTeX(SumRight, true, true) → text1Sequence(Polygon[(i, 0), (i + N, 0), (i + N, f(i)), (i, f(i))], i, 0, X - N, N) → list3Sum(list3) → SumLeftLaTeX(SumLeft, true, true) → text2LaTeX(AvgSum, true, true) → text3
AI Drawing Prompt Reference
Create a graph showing Riemann sum rectangles approximating the area under a function curve. Use left, right, and midpoint rectangles with adjustable count via a slider. Rectangles span from x=0 to an upper limit, with heights based on function values at left, right, or midpoint of each subinterval. Display the three sum values as formulas. The graph should illustrate how increasing rectangle count makes the total area approach the true integral, with clear visual distinction between rectangle types and the curve.
The prompt above was compiled from the original drawing commands and is for reference only.