
Area Under a Curve Demonstration
Loading the math board and drawing, please wait…
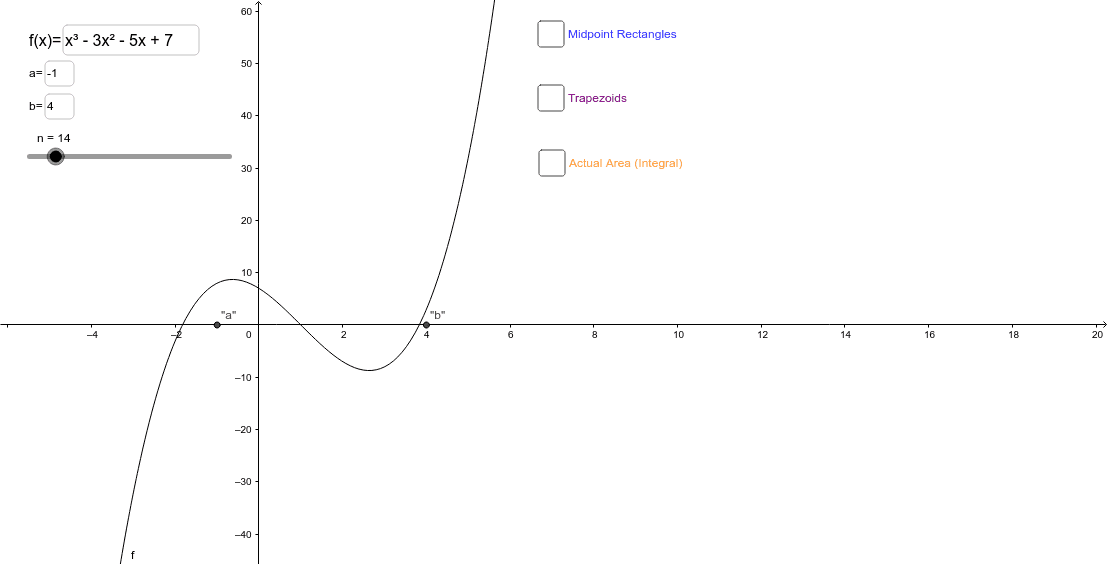
This example demonstrates the process of calculating the area under a curve, including geometric interpretation. Key math concepts involve integral, limit, function graphing, and trapezoidal sum methods. GeoGebra commands like RectangleSum, Integral, and TrapezoidalSum are used to visualize the function, compute area, and adjust parameters dynamically. Suitable for high school mathematics education to understand the geometric meaning and calculation methods of definite integrals and numerical integration.
GeoGebra Commands & Parameters
RectangleSum(f, a, b, n, 1) → RightRectangleSum(f, a, b, n, 0.5) → MidpointRectangleSum(f, a, b, n, 0) → LeftTextfield(a) → inputBox1Textfield(b) → inputBox2Integral(f, a, b) → IntegralTextfield(f) → inputBox3TrapezoidalSum(f, a, b, n) → Trapezoid
AI Drawing Prompt Reference
Draw the area under the curve of function f(x) in the interval [a, b] using the rectangle and trapezoidal methods for approximation. First, plot the function graph, then use the left, midpoint, and right rectangle methods to calculate the area respectively, and finally use the trapezoidal method to calculate the area and display the integral result.
The prompt above was compiled from the original drawing commands and is for reference only.