
Riemann Sum and Definite Integral by Dick Lane
Loading the math board and drawing, please wait…
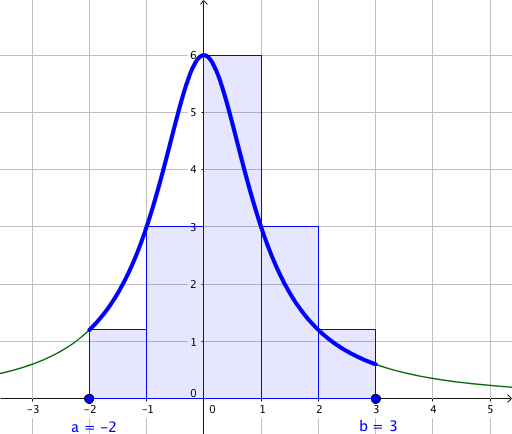
This example demonstrates how Riemann sums approximate definite integrals visually, showing the function graph, interval partitioning, and summing the areas of small rectangles. Core mathematical concepts include definite integrals, Riemann sums, and geometric intuition. Construction highlights the use of GeoGebra commands like LeftSum, Textfield, RectangleSum, and Integral, along with objects such as n (partition count), f (function), a,b (limits), and F (integral function). Suitable for high school and introductory college students to grasp the geometric basis and computation principles of definite integrals.
GeoGebra Commands & Parameters
LeftSum(f, a, b, n) → LSTextfield(f) → FsetTextfield(a) → AsetTextfield(b) → BsetRectangleSum(f, a, b, n, 1) → RSIntegral(f, a, b) → DI
AI Drawing Prompt Reference
Draw a graph of a function's definite integral, including the left Riemann sum and the accumulated geometric area in the interval [a, b]. First, plot the graph of function f, then partition the interval [a, b] into n subintervals, approximate the area of each subinterval with rectangles, and finally calculate the definite integral of the entire interval.
The prompt above was compiled from the original drawing commands and is for reference only.