
Relativity 02: Wave Velocity & Probability Demo
Loading the math board and drawing, please wait…
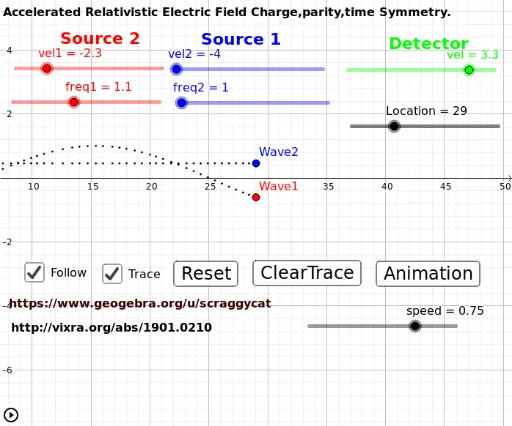
This example demonstrates the graphical phenomena of wave velocity variation and probability distribution in relativity. Core math concepts include derivatives, probability & statistics, symmetry, angles, polygons, curve sketching, and scatter plots. Construction highlights GeoGebra commands like Length, WavePoint1/WavePoint2, freq1/freq2, Animation, Trace1/Trace2, and Follow. Suitable for high school and above, ideal for interdisciplinary physics and math teaching on relativity.
GeoGebra Commands & Parameters
Length(Trace2) → Len
AI Drawing Prompt Reference
Create a graph demonstrating wave velocity variation and probability distribution in relativity. First, draw two curves representing waves with different frequencies. Then, mark points on these curves to show wave propagation. Use animation to display the movement of these points and a scatter plot to show their trajectories. Finally, add labels to indicate wavelength and probability distribution.
The prompt above was compiled from the original drawing commands and is for reference only.