
Rekenrek 4 Rows Screen Demo
Loading the math board and drawing, please wait…
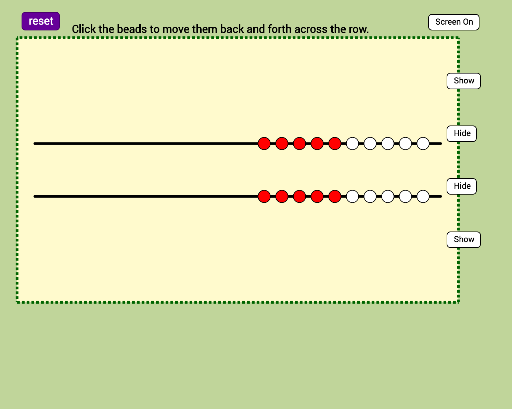
This example demonstrates the use of Rekenrek for visualizing and calculating with four rows of numbers. It involves core mathematical concepts such as number sense, addition, subtraction, and visual mathematical thinking. The construction uses GeoGebra commands and objects like Segment, Point, Sum, Polygon, and Line to create and manipulate the number bars and screen layout. It is suitable for elementary mathematics education to help students understand number operations and develop number sense.
GeoGebra Commands & Parameters
Segment((0, 11), (23, 11)) → fPoint(f) → APoint(f) → BPoint(f) → CPoint(f) → DPoint(f) → EPoint(f) → FPoint(f) → IPoint(f) → JPoint(f) → GPoint(f) → HPoint(f) → KPoint(f) → LPoint(f) → MPoint(f) → NPoint(f) → OPoint(f) → PPoint(f) → QPoint(f) → RPoint(f) → SPoint(f) → TSum(row1list) → row1valueSegment((0, 8), (23, 8)) → gPoint(g) → UPoint(g) → VPoint(g) → WPoint(g) → ZPoint(g) → A_1Point(g) → B_1Point(g) → C_1Point(g) → D_1Point(g) → E_1Point(g) → F_1Point(g) → G_1Point(g) → H_1Point(g) → I_1Point(g) → J_1Point(g) → K_1Point(g) → L_1Point(g) → M_1Point(g) → N_1Point(g) → O_1Point(g) → P_1Sum(row2list) → row2valuePolygon(Q_1, R_1, S_1, T_1) → poly1, q_1, r_1, s_1, t_1Segment((0, 5), (23, 5)) → hPoint(h) → U_1Point(h) → V_1Point(h) → W_1Point(h) → Z_1Point(h) → B_2Point(h) → A_2Point(h) → C_2Point(h) → D_2Point(h) → E_2Point(h) → F_2Point(h) → G_2Point(h) → H_2Point(h) → I_2Point(h) → J_2Point(h) → K_2Point(h) → L_2Point(h) → M_2Point(h) → N_2Point(h) → O_2Point(h) → P_2Segment((0, 2), (23, 2)) → iPoint(i) → Q_2Point(i) → R_2Point(i) → S_2Point(i) → T_2Point(i) → U_2Point(i) → V_2Point(i) → W_2Point(i) → Z_2Point(i) → A_3Point(i) → B_3Point(i) → C_3Point(i) → D_3Point(i) → E_3Point(i) → F_3Point(i) → G_3Point(i) → H_3Point(i) → I_3Point(i) → J_3Point(i) → K_3Point(i) → L_3Sum(row3list) → row3valueSum(row4list) → row4valueLine(M_3, y = 0) → jPoint(j) → N_3Line(M_3, x = 0) → kPoint(k) → O_3Polygon(M_3, O_3, P_3, N_3) → poly2, m_3, o_3, p_3, n_3
AI Drawing Prompt Reference
Draw a visual arithmetic tool with four rows of numbers, the top row has 24 points connected by horizontal lines, below it rows have 23 and 22 points respectively, all points represented as small circles, forming a calculator screen layout to display numbers and calculation processes.
The prompt above was compiled from the original drawing commands and is for reference only.