
Rectangle Method
Loading the math board and drawing, please wait…
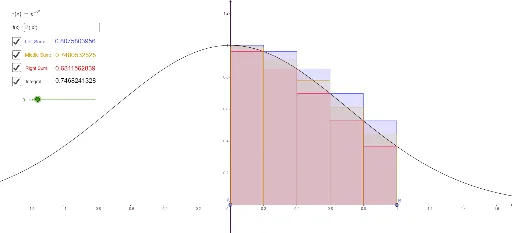
This example demonstrates the application of the rectangle method in calculating the area under a curve. Key mathematical concepts include integral calculus and rectangles. Using GeoGebra commands such as Point, RectangleSum, and Integral, users can dynamically adjust intervals and the number of rectangles to observe changes in the approximation. Suitable for high school mathematics education and learning integral calculus.
GeoGebra Commands & Parameters
Point(xAxis) → APoint(xAxis) → BRectangleSum(f, x(A), x(B), n, 0) → leftsumRectangleSum(f, x(A), x(B), n, 1) → rightsumIntegral(f, x(A), x(B)) → integralRectangleSum(f, x(A), x(B), n, 0.5) → middlesumTextfield(f) → CampoInserimento1LaTeX(f, true, true) → testo4
AI Drawing Prompt Reference
Draw a function graph and display three types of rectangle methods for approximating the integral under the curve: left rectangles, right rectangles, and middle rectangles, with the exact integral area shown, all rectangles and areas should be adjustable in number and interval, and the function expression should be labeled.
The prompt above was compiled from the original drawing commands and is for reference only.