
Rectangle Area Model
Loading the math board and drawing, please wait…
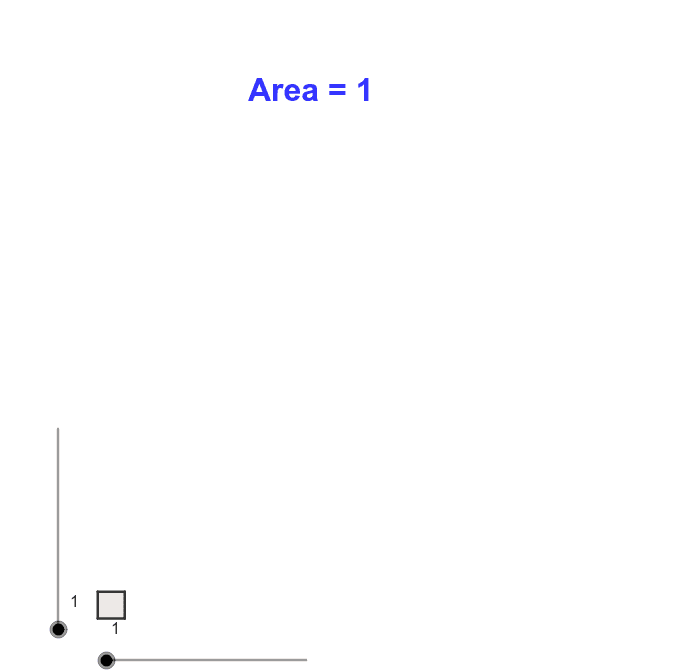
This example demonstrates how to dynamically construct and visualize the area calculation of a rectangle. It involves core math concepts like area, rectangles, and optimization problems. Key GeoGebra commands/objects used include Sequence, Polygon, Circle, and Point. Suitable for high school students learning geometry and optimization problems.
GeoGebra Commands & Parameters
Sequence((x(A) + (unitsize * i), y(A)), i, 1, Factor2) → list1Sequence((x(A) + (unitsize * i), y(A) + (Factor1 * unitsize)), i, 1, Factor2) → list2Sequence((x(A), y(A) + (unitsize * i)), i, 1, Factor1) → list3Sequence((x(A) + Factor2, y(A) + (unitsize * i)), i, 1, Factor1) → list4Polygon(A, Element[list1, Factor2], Element[list2, Factor2], Element[list3, Factor1]) → poly1, a, b, c, dCircle(B, unitsize) → fPoint(f) → CCircle(C, unitsize) → gPolygon(B, C, 4) → poly2, h, i, j, k, D, ESequence(Segment[(x(A), y(A) + (unitsize * i)), (x(A) + (Factor2 * unitsize), y(A) + (unitsize * i))], i, 0, Factor1) → dottedhorizontalsSequence(Segment[(x(A) + (unitsize * i), y(A)), (x(A) + (unitsize * i), y(A) + (Factor1 * unitsize))], i, 0, Factor2) → dottedverticals
AI Drawing Prompt Reference
Draw a rectangle shape where the length and width can be adjusted using a slider. Inside the rectangle, there is a circle centered at the rectangle's center. Around the rectangle, there are thin lines indicating the boundaries and internal structure. This graphic is used to demonstrate rectangle area calculation and optimization problems, suitable for geometry learning and optimization demonstrations.
The prompt above was compiled from the original drawing commands and is for reference only.