
Reasoning about Rates - Yellow Bowties I
Loading the math board and drawing, please wait…
In collections
Functions on the Domain of Space - Polygons
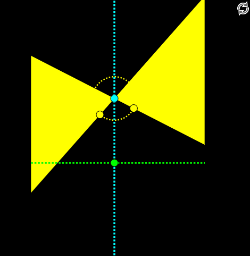
① This example demonstrates a dynamic geometric construction that illustrates reasoning about rates using area, fractions, and limits, visualized through a yellow bowtie-shaped figure. ② Core mathematical concepts include area comparison, fractional proportions, normal distribution (as a probability density background), limits, and rate relationships described by differential equations. ③ Construction highlights: from the construction summary, commands such as Segment, Point, Circle, Line, Intersect, and Polygon are used, creating multiple objects (e.g., a, i, H, h, b, A, c, B, C, d, e, D, E, F, G, f, g, poly1, etc.), with a button (button1) for interactive control, likely involving sliders or dynamic adjustments. ④ Suitable for high school to early college students, this helps understand the intuitive connection between rates, area, and limits, and can serve as teaching material for introductory calculus or visualizing normal distributions in probability and statistics.
GeoGebra Commands & Parameters
Segment((-2, 0), (2, 0)) → iPoint(i) → HPoint(h) → ACircle(A, 0.5) → cPoint(c) → BPoint(c) → CLine(A, B) → dLine(A, C) → eIntersect(d, a) → DIntersect(d, b) → EIntersect(e, b) → FIntersect(e, a) → GSegment(D, E) → fSegment(F, G) → gPolygon(F, A, E) → poly1, e_1, f_1, a_1Polygon(A, D, G) → poly2, g_1, a_2, d_1
AI Drawing Prompt Reference
Draw a yellow bowtie-shaped geometric figure. Start with a horizontal segment as a base, place a point on it, and another point nearby as the center of a small circle. From the center, draw two rays to two points on the circle, intersecting two horizontal guide lines, creating four intersection points. Connect the upper and lower pairs of intersections with two slanted segments. Finally, form two triangular regions using the slanted segments and the horizontal base, creating a symmetric bowtie. Optionally, overlay a faint normal distribution curve in the background to illustrate reasoning about rates and areas.
The prompt above was compiled from the original drawing commands and is for reference only.