
Read and Submit Coordinates Quadrant I
Loading the math board and drawing, please wait…
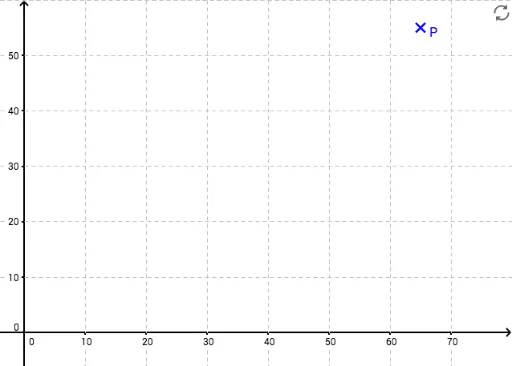
This example demonstrates how to read and submit coordinates in the first quadrant. Core math concepts include coordinate geometry and trigonometric functions. Key GeoGebra commands used for constructing and manipulating points, coordinates, and geometric shapes are Element, Random, If, Corner, Join, Point, etc. Suitable for middle school and above students for learning and practicing coordinate geometry knowledge.
GeoGebra Commands & Parameters
Element(sectionList, area) → typeRangeElement(typeRange, 1) → x_{min}Element(typeRange, 2) → x_{max}Element(typeRange, 3) → y_{min}Element(typeRange, 4) → y_{max}Random(1, 2) → TypIf(y_{min} ≟ 0, ((-Ky_{max})) / 10, (floor(Random[y_{max}, 0] / 10) * 10)) → Ky_{min}Corner(1) → AIf(Kx_{max} < 10, 0.5, If[Kx_{max} < 30, 1, If[Kx_{max} < 50, 2, 5]]) → exactly_xIf(Ky_{max} < 10, 0.5, If[Ky_{max} < 30, 1, If[Ky_{max} < 50, 2, 5]]) → exactly_yRandom(1, 2) → taskTypeIf(TestP ≟ P, true, false) → ControlTestPJoin({{(((-Kx_{max})) / 30, ((-Ky_{max})) / 20)}, Sequence[Sequence[(i, j), i, 0, Kx_{max}, exactly_x], j, 0, Ky_{max}, exactly_y]}) → testItemsPoint(testItems) → TestP2If(VeryGoodControl, Element[performLevels, 1], If[GoodControl, Element[performLevels, 2], Element[performLevels, 3]]) → performLevel
AI Drawing Prompt Reference
Draw a coordinate system in the first quadrant with x-axis range from -10 to 10 and y-axis range from -10 to 10. Randomly generate a point P and plot it on the coordinate system. Based on the position of point P, determine if it falls within a specific area and draw test items accordingly.
The prompt above was compiled from the original drawing commands and is for reference only.