
Rational Power Functions and Their Inverse
Loading the math board and drawing, please wait…
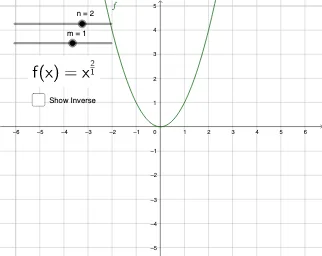
This example uses GeoGebra to demonstrate how rational (fractional) power functions relate to their inverses, highlighting the resulting changes in graph shape and the visual correspondence between the function and its inverse. Key mathematical ideas include power functions with rational exponents, the interpretation of domain/range for fractional powers, and the geometric meaning of an inverse function (how the graph can be obtained via reflection/symmetry principles). Construction-wise, the model introduces parameters such as n and m, defines function objects (Funktion, f, and h) to represent different function forms, and uses show to control what is rendered on screen. It also includes Text1 for labeling key features and relies on an additional graphical/helper object (g) to manage the displayed curve relationships. Suitable for upper secondary and early college learners studying functions, graphs, and inverse-function concepts in algebra and coordinate geometry.
GeoGebra Commands & Parameters
Numeric n(2)Numeric m(1)f(x) = x^(n / m)h(x) = xBoolean show(false)g(x) = x^(m / n)
AI Drawing Prompt Reference
Draw a graph of a rational power function and its inverse. The key objects are f(x) = x^(n/m) and h(x) = x. Show the relationship between f(x) and h(x) using an auxiliary curve g(x) = x^(m/n). Add text labels to highlight key features.
The prompt above was compiled from the original drawing commands and is for reference only.