
Exponential Functions and Their Inverses
Loading the math board and drawing, please wait…
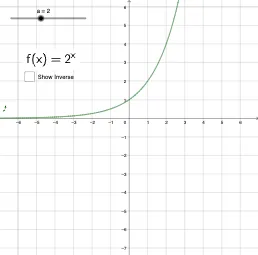
This example demonstrates how the graph of an exponential function relates to the graph of its inverse by placing them side by side and revealing the key geometric correspondence (notably the mirror symmetry with respect to the line y = x). The main mathematical ideas are exponential functions, the concept and definition of an inverse function, and how swapping inputs and outputs affects the graph. From the construction summary, the diagram is assembled using GeoGebra objects such as a, g, h, and show to manage and display the visual elements, along with f and Funktion to define the function(s). Text1 is used to provide explanatory labels, making the relationship between the original function and its inverse easy to observe. Suitable for secondary-level advanced math through introductory university work, especially for lessons on function graphs, inverse functions, and graph-based reasoning.
GeoGebra Commands & Parameters
Numeric a(2)g(x) = a^(x)h(x) = xBoolean show(false)f(x) = log(a, x)
AI Drawing Prompt Reference
Create a side-by-side view in one coordinate plane showing two key curves related by inverse correspondence. Use the constant a=2 and plot the exponential function y=a^x. Next, represent the inverse relationship by plotting y=log(a, x) on the same axes. Add the reference line y=x to highlight the geometric correspondence as mirror symmetry with respect to this line. Organize the construction by first setting a=2, then defining the two functions, and finally including the y=x line and clear textual labels describing the relationship between the original function and its inverse.
The prompt above was compiled from the original drawing commands and is for reference only.