
Rational Inequalities Demo
Loading the math board and drawing, please wait…
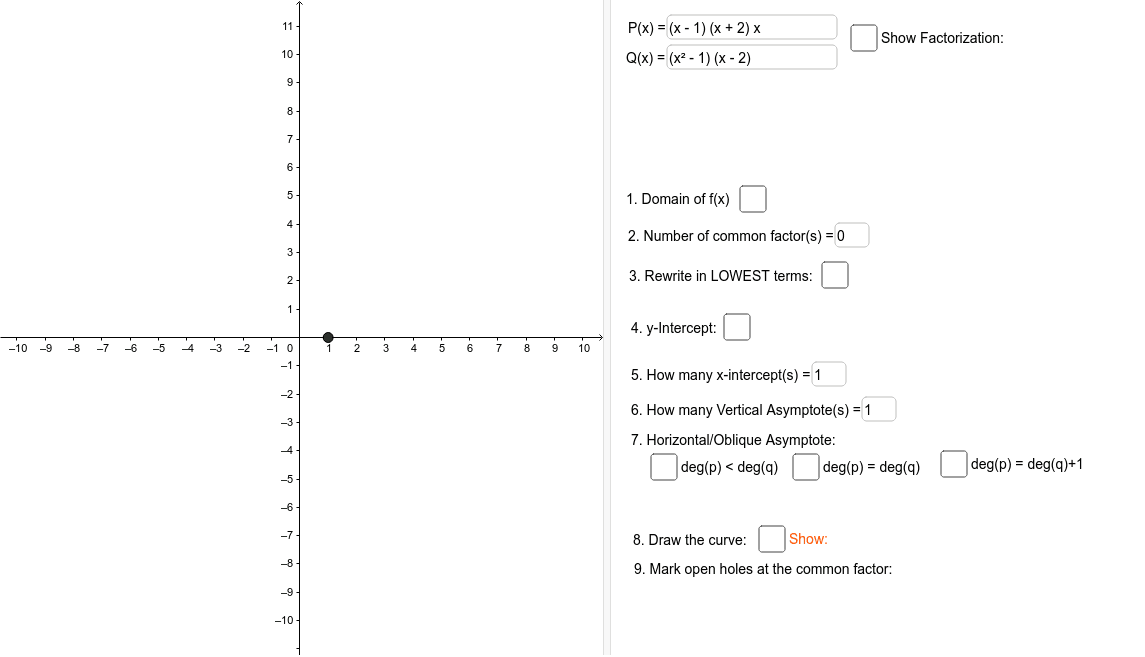
This example demonstrates how to dynamically visualize the solution set and graph behavior of rational inequalities using GeoGebra. It involves core concepts like rational functions, inequality solving, geometric mean, coefficient analysis, polynomial factoring. Key GeoGebra commands and objects used include Textfield, Factor, Simplify, Point, Coefficients, Degree, Sequence, Element, Sort, Length, Polygon, enabling function graphing, factoring, and solution set visualization. Suitable for high school and above mathematics learners to understand the properties and solving methods of rational inequalities.
GeoGebra Commands & Parameters
Textfield(P) → InputBox1Textfield(Q) → InputBox2Factor(P) → PfactorFactor(Q) → QfactorFactor(f) → ffactorSimplify(P(x) / f(x)) → pSimplify(Q(x) / f(x)) → qTextfield(nocommonfactor) → InputBox3Factor(p) → pfacFactor(q) → qfacPoint(yAxis) → ACoefficients(p) → pcoefCoefficients(q) → qcoefDegree(p) → pdegDegree(q) → qdegTextfield(pdegin) → InputBox5Textfield(qdegin) → InputBox6Sequence(x = x(Element[list2, i]), i, 1, qdeg) → vaElement(Division[p, q], 1) → quotSort(Join[{list1, list2}]) → guideptLength(guidept) → guideptnoSort(Join[{guide, guidept}]) → guideptjoinSequence(Segment[Element[guideptjoin, i], Element[guideptjoin, i + 1]], i, 1, guideptno + 1) → partSequence(Point[Element[part, i]], i, 1, guideptno + 1) → tDegree(ffactor) → ffactordegSequence(x(Element[Remove[{Root[Q]}, list2], 1]), i, 1, Length[Remove[{Root[Q]}, list2]]) → nondomainSequence((x(Element[Remove[{Root[Q]}, list2], i]), g(x(Element[Remove[{Root[Q]}, list2], i]))), i, 1, Length[Remove[{Root[Q]}, list2]]) → holesPolygon((x(Corner[1]), 0), (x(Corner[2]), 0), Corner[3], Corner[4]) → poly1, f_1, g_1, h_1, i_1Polygon((x(Corner[1]), 0), (x(Corner[2]), 0), Corner[2], Corner[1]) → poly2, j_1, k_1, l_1, m_1
AI Drawing Prompt Reference
Create a dynamic visualization for rational inequalities, showing input boxes for numerator and denominator, factorization results, and graphs of simplified rational functions. Analyze coefficients and degrees, mark solution sets, represent solution regions with polygons, and handle points where the denominator is zero.
The prompt above was compiled from the original drawing commands and is for reference only.