
Rational Function Graph with Vertical & Horizontal Asymptotes
Loading the math board and drawing, please wait…
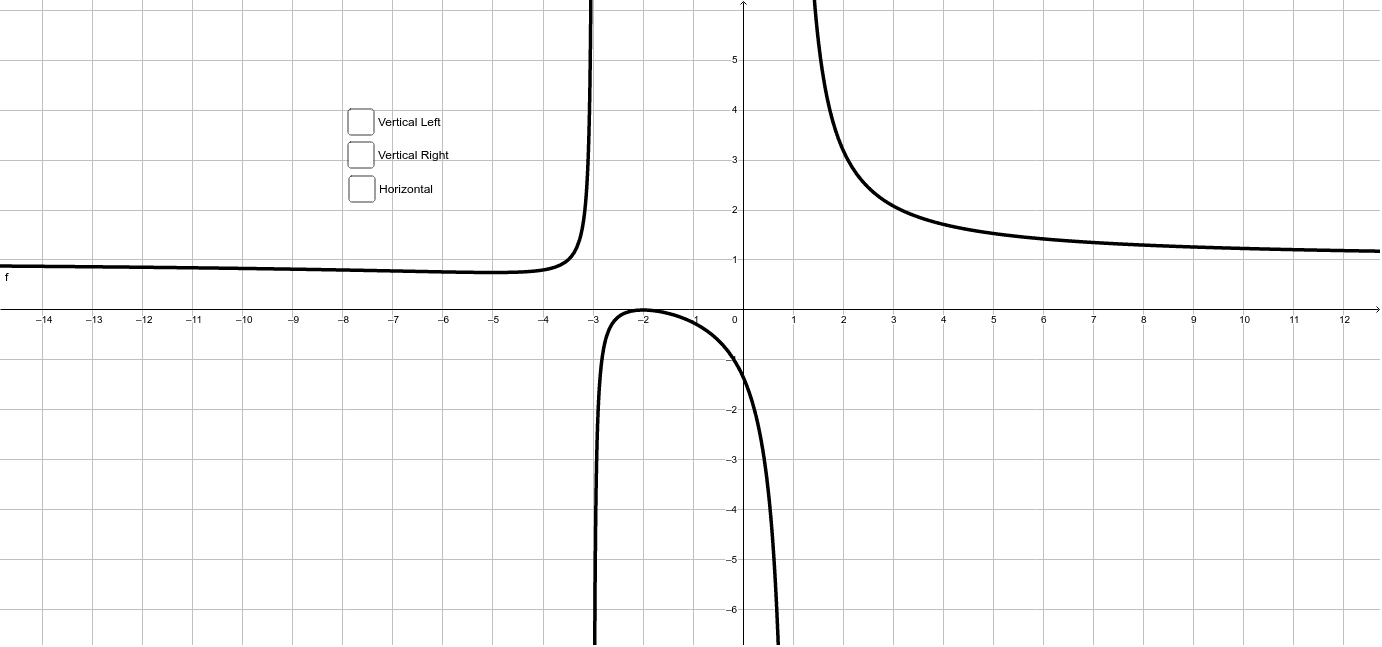
This example demonstrates the graph of a rational function with two vertical asymptotes and one horizontal asymptote that the function crosses. Key math concepts include rational functions, asymptotes, and function graphing. It uses GeoGebra objects f (function), a, b (vertical asymptote parameters), c, d (horizontal asymptote parameters), e (function graph), and g (auxiliary object). Suitable for high school mathematics learning to understand the properties of rational functions and the plotting of asymptotes.
GeoGebra Commands & Parameters
f(x) = (((x + 2)^(2) * (x - 4))) / ((((x + 3) * (x - 4)) * (x - 1)))a:x = -3b:x = 1c:y = 1Boolean d(false)Boolean e(false)Boolean g(false)
AI Drawing Prompt Reference
Draw the graph of a rational function with two vertical asymptotes at x=-3 and x=1, and a horizontal asymptote at y=1 that the function crosses. First plot the function, then draw the vertical asymptotes at x=-3 and x=1, and finally draw the horizontal asymptote at y=1 to show the relationship between the function and the asymptotes.
The prompt above was compiled from the original drawing commands and is for reference only.