
Range of a Sinusoidal Accuracy Quiz
Loading the math board and drawing, please wait…
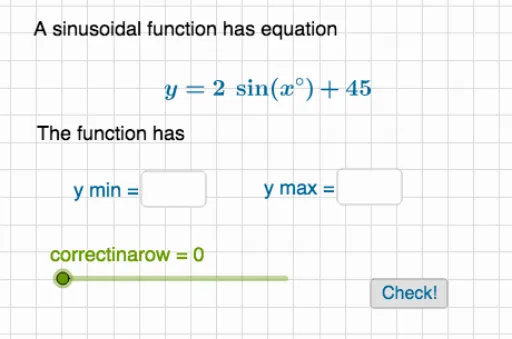
This interactive quiz demonstrates the range of a sinusoidal function through randomized practice problems. It visually presents a sine curve with randomly generated amplitude and vertical shift, and asks the learner to input the correct maximum and minimum values. The core mathematical concepts involve the graph of sine functions, amplitude, vertical translation, and the calculation of the range (max and min). The construction uses GeoGebra commands such as RandomElement and Random to generate parameters, Textfield and InputBox for user input, Max and Min to compute theoretical bounds, and button1 along with text objects (text3, text4, etc.) to provide instant feedback and track consecutive correct answers (correctinarow). This resource is suitable for high school or introductory college students, serving as a self-assessment tool to reinforce understanding of sinusoidal range in a dynamic, randomized setting.
GeoGebra Commands & Parameters
RandomElement(alist) → aRandom(-20, 50) → dTextfield(emptymin) → InputBox1Textfield(emptymax) → InputBox2Max({g(90), g(270)}) → ymaxMin({g(90), g(270)}) → ymin
AI Drawing Prompt Reference
Draw a sine curve with randomly chosen amplitude and vertical shift, oscillating across a coordinate plane. Place two input boxes beside the graph for entering the maximum and minimum values. Mark the theoretical highest and lowest points on the curve. Include a submit button and a text display showing the streak of correct answers. The layout should be clean and suitable for an interactive quiz interface.
The prompt above was compiled from the original drawing commands and is for reference only.