
Range and Period of Sine: Interactive Graph and Function
Loading the math board and drawing, please wait…
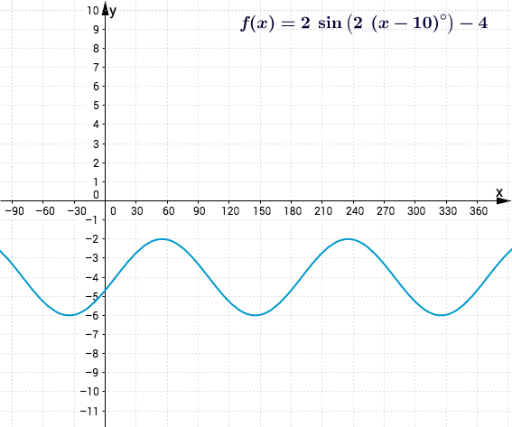
This GeoGebra example demonstrates the range and period of the sine function through an interactive graph and its algebraic representation. It visually shows how the sine curve oscillates between -1 and 1, and how its period is 2π, while allowing users to explore the effects of random parameters on the function. Core mathematical concepts include amplitude, period, range, and the relationship between the function formula and its graph. The construction uses GeoGebra commands such as RandomElement and Random to generate random coefficients, Polygon to create auxiliary shapes, and a button (button1) to trigger random updates. Text objects (text1, text2, text3) display the function expression and key values. This resource is suitable for high school or introductory college students learning trigonometry, providing an interactive way to grasp the fundamental properties of sine functions and observe how parameter changes affect the graph.
GeoGebra Commands & Parameters
RandomElement({1, 2, 3, 4, 5, 6, 10}) → bRandom(-4, 3) → dRandomElement({-6, -5, -4, -3, -2, -1, 1, 2, 3, 4, 5, 6}) → aRandomElement({0, 10, 20, 30, 40}) → cPolygon(A, B, C, D) → poly1, a_1, b_1, c_1, d_1