
Random Piecewise Function Creator and Grapher
Loading the math board and drawing, please wait…
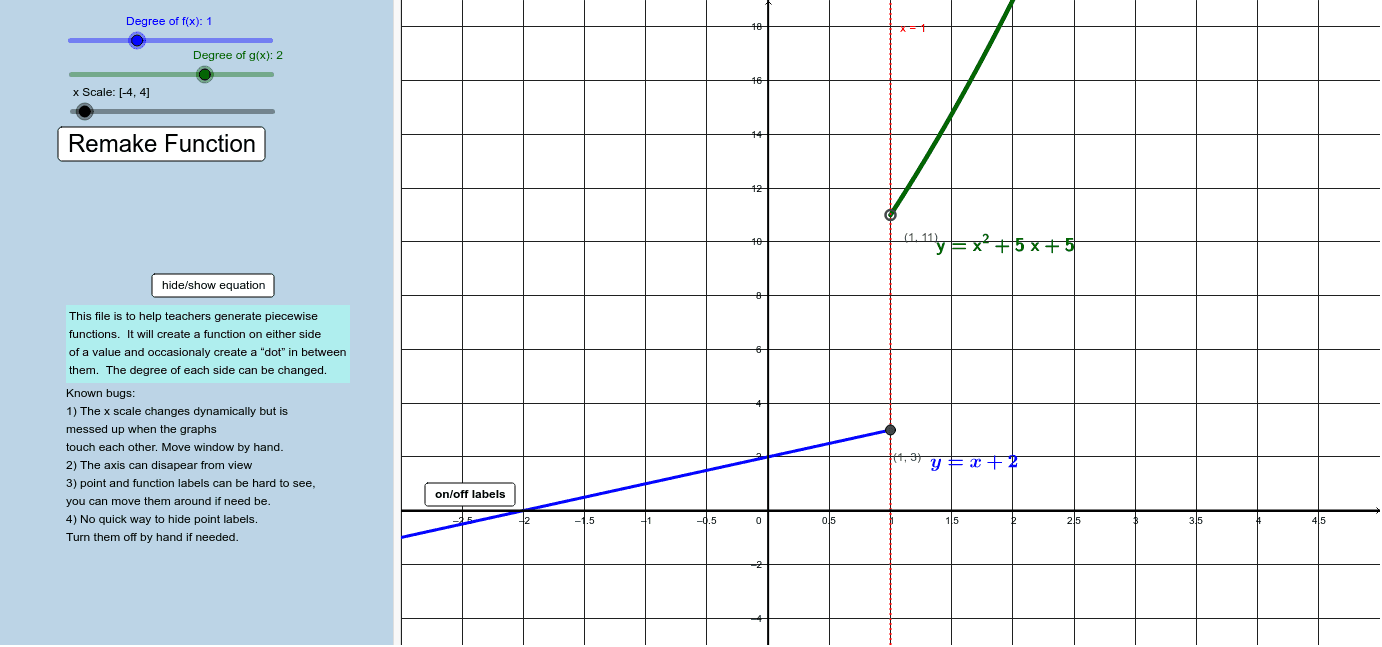
This GeoGebra example generates an endless number of piecewise functions, displaying correct domain inequalities and proper 'dots' on the function graphs. It involves core mathematical concepts such as piecewise functions, inequalities, and function graphing. Constructed using GeoGebra commands like Random, RandomPolynomial, If, and objects including d_g, d_f, E, f, button1, g, leftEqual, A, C, fLess, B, A_h, B_h, E_y, x_a, a, text1, b, c, f_a, f_b, g_a, g_b, text5, text6, text3, text7, text2, text8, button2, names, eq, button3, text4. Suitable for high school and above students to learn and understand the properties of piecewise functions and the application of inequalities.
GeoGebra Commands & Parameters
Random(-5, 5) → ERandomPolynomial(d_f, 0, 6) → fRandomPolynomial(d_g, 0, 6) → gRandom(1, 3) → leftEqualIf(f(E) < g(E), true, false) → fLess
AI Drawing Prompt Reference
Draw a graph of a piecewise function showing different function values in different intervals. Ensure the graph includes correct interval inequalities and points to mark function values. The graph should be continuous and clear, suitable for learning about piecewise functions and inequalities.
The prompt above was compiled from the original drawing commands and is for reference only.