
Intro to Limits Example: Tabular and Graphical
Loading the math board and drawing, please wait…
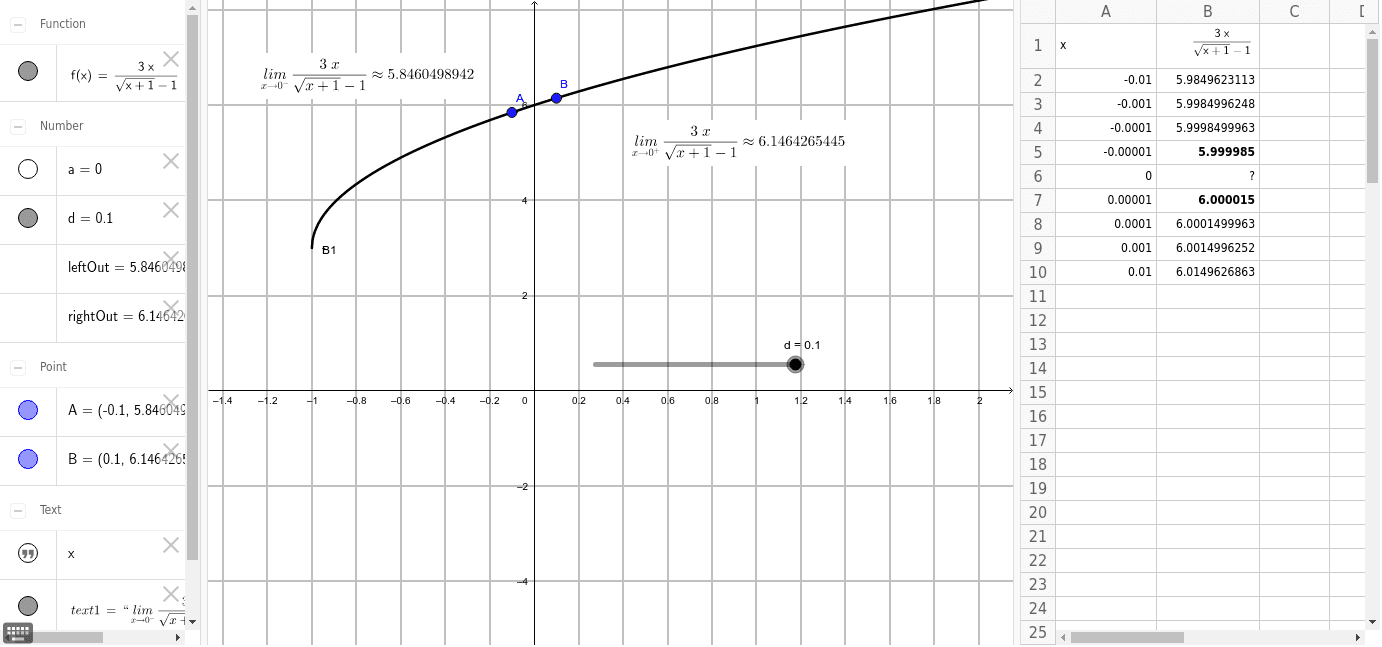
This example demonstrates calculating two one-sided limits on a square root function using both tabular and graphical methods. It involves core math concepts like limits, one-sided limits, and function graphs. The construction uses GeoGebra commands/objects such as f (function), points A1-A10 and B1-B10, leftOut and rightOut, text1 and text2, distance d, parameter a, points A and B, and slider animations. Suitable for high school calculus students to understand limit concepts and function behavior.
GeoGebra Commands & Parameters
f(x) = ((3 * x)) / (sqrt(x + 1) - 1)Numeric A2(-0.01)A2 / 10A3 / 10A4 / 10Numeric A6(0.0)(-A5)(A7 * 10)(A8 * 10)(A9 * 10)f(A2)f(A3)f(A4)f(A5)f(A6)f(A7)f(A8)f(A9)f(A10)Numeric d(0.1)Numeric a(0.0)(a - d, f(a - d))(a + d, f(a + d))y(A)y(B)f
AI Drawing Prompt Reference
Draw a square root function graph to demonstrate the left and right limits as x approaches -1. Use both tabular and graphical methods, and adjust parameters a and d to observe the function behavior. First, plot the function f(x) = (3x) / (sqrt(x + 1) - 1), then add points A and B representing the function values at x=a-d and x=a+d, respectively. Finally, use the slider to adjust the values of a and d and observe the limit changes near x=-1.
The prompt above was compiled from the original drawing commands and is for reference only.