
Quartiles and Boxplot Drawing
Loading the math board and drawing, please wait…
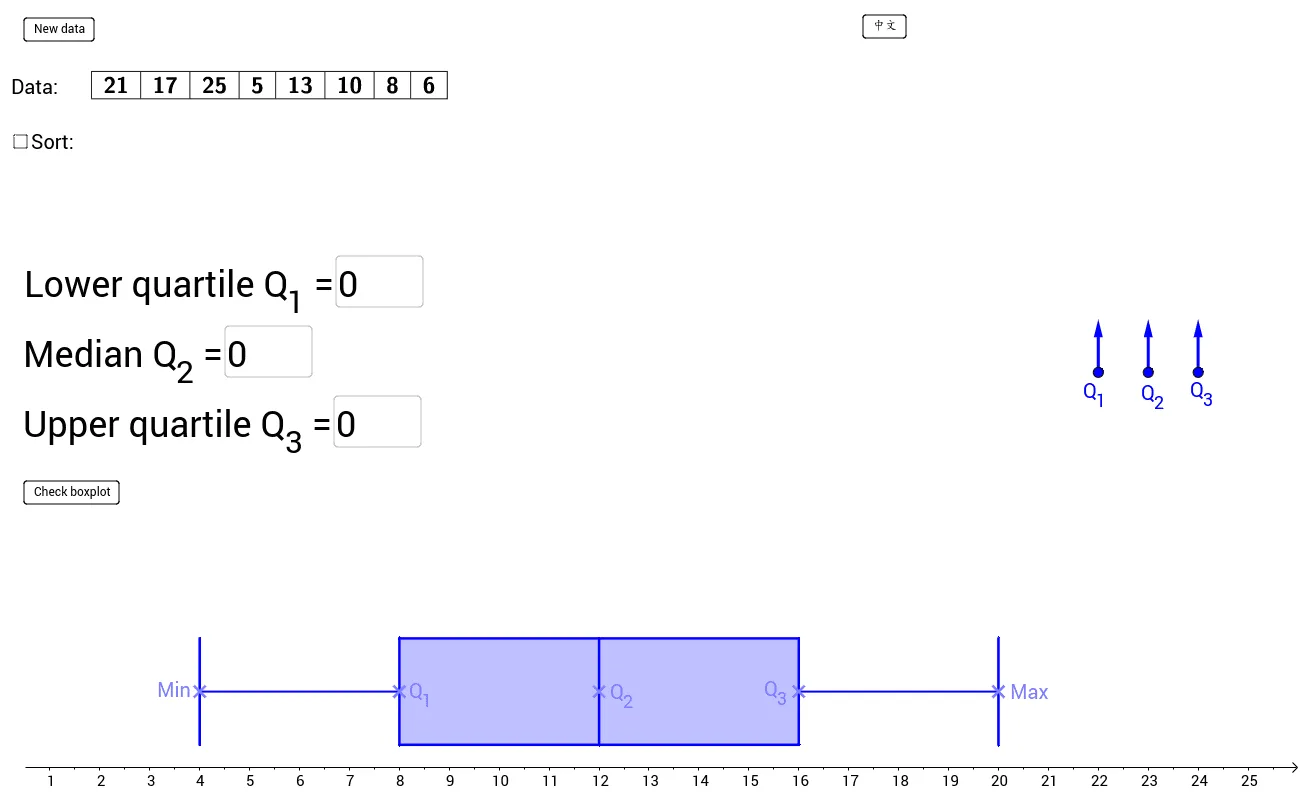
This example demonstrates how to draw a boxplot based on input quartiles (Q1, Q2, Q3). Core math concepts include quartiles, median, and data distribution. Construction highlights involve GeoGebra commands/objects like Point, Random, Vector, Sequence, Sort, TableText, Q1, Q3, Median, Textfield, DynamicCoordinates, Segment, Polygon, BoxPlot, If. Suitable for high school mathematics teaching, helping students understand data distribution and visualization representation.
GeoGebra Commands & Parameters
Point(L) → H'Point(L) → G'Point(L) → F'Point(L) → E'Point(L) → D'Random(NumberMin, NumberMax) → nVector(A, A + (0, 1)) → u_1Vector(B, B + (0, 1)) → u_2Vector(C, C + (0, 1)) → u_3Sequence(Random[DataMin, DataMax], i, 1, n) → list1Sort(list1) → list2TableText({list2}, "c|_") → text1TableText({list1}, "c|_") → text2Q1(list2) → Q_1Q3(list2) → Q_3Median(list2) → Q_2Textfield(input1) → inputBox1Textfield(input2) → inputBox2Textfield(input3) → inputBox3DynamicCoordinates(D', round(2 * x(D')) / 2, round(2 * y(D')) / 2) → DDynamicCoordinates(E', round(2 * x(E')) / 2, round(2 * y(E')) / 2) → EDynamicCoordinates(F', round(2 * x(F')) / 2, round(2 * y(F')) / 2) → FDynamicCoordinates(G', round(2 * x(G')) / 2, round(2 * y(G')) / 2) → GDynamicCoordinates(H', round(2 * x(H')) / 2, round(2 * y(H')) / 2) → HSegment(D, E) → sh1Segment(G, H) → sh2Polygon(E + (0, 1), E - (0, 1), G - (0, 1), G + (0, 1)) → boxplot2, a, b, c, dSegment(D - (0, 1), D + (0, 1)) → s1Segment(F - (0, 1), F + (0, 1)) → s3Segment(H - (0, 1), H + (0, 1)) → s5BoxPlot(4, 0.5, list2) → boxplotIf(Chinese, "數據:", "Data:") → text3If(Chinese, "←正確", "←Correct") → text4If(Chinese, "←正確", "←Correct") → text5If(Chinese, "←正確", "←Correct") → text6If(Chinese, "←不正確", "←Incorrect") → text7If(Chinese, "←不正確", "←Incorrect") → text8If(Chinese, "←不正確", "←Incorrect") → text9If(Chinese, "框線圖正確!", "Correct boxplot!") → text10If(Chinese, "部分出錯 ...", "something wrong ...") → text11
AI Drawing Prompt Reference
Draw a boxplot to show data distribution. Generate a set of random data points, then calculate and mark the first, second (median), and third quartiles. Connect the quartile points with line segments to form the box's top and bottom edges and sides. Add whiskers at the data range ends to highlight the minimum and maximum values. Finally, label the data points and quartile values below the plot.
The prompt above was compiled from the original drawing commands and is for reference only.