
Quantitative Analysis of Square-ness of Rectangles with Function Graphs
Loading the math board and drawing, please wait…
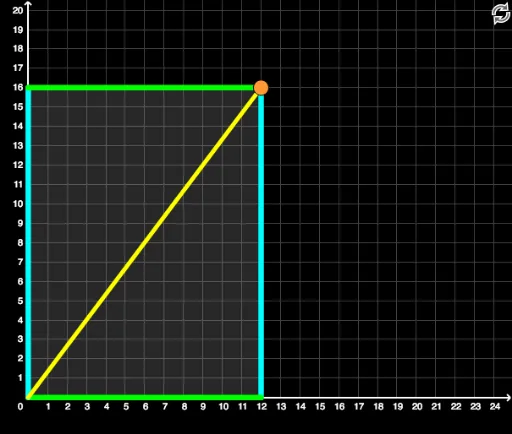
This GeoGebra applet revisits the quantitative relationship between rectangles and their inscribed squares, exploring the concept of "square-ness." By dynamically constructing rectangles and their inscribed squares, the example demonstrates how the area ratio, perimeter relationships, and corresponding logarithmic and hyperbolic function patterns change with varying rectangle dimensions. Key mathematical concepts include: rectangle and square properties, correlation analysis, logarithmic functions, hyperbolas, conic sections, and geometric translations. The construction uses GeoGebra commands: Polygon for creating rectangles and squares, Distance for measuring side lengths, If for conditional logic, Area and Perimeter for geometric calculations, Segment and Length for auxiliary constructions. Suitable for high school mathematics teaching integrating geometric intuition with function visualization, and as an introductory example for undergraduate studies in elementary geometry.
GeoGebra Commands & Parameters
Polygon(A, C, B, D) → poly1, a, c, b, dDistance(a, d) → eIf(a / c > c / a, a / c, c / a) → sq3Area(poly1) → B1Perimeter(poly1) → B3Polygon(E, F, H, G) → poly2, e_1, f_1, h_1, g_1Polygon(I, J, L, K) → poly3, i_1, j, l, kPolygon(M, N, P, O) → poly4, m, n, p, oPolygon(Q, R, S, T) → poly5, q, r, s, tSegment(A, B) → fLength(f) → g