
Quadratics and Parabolas
Loading the math board and drawing, please wait…
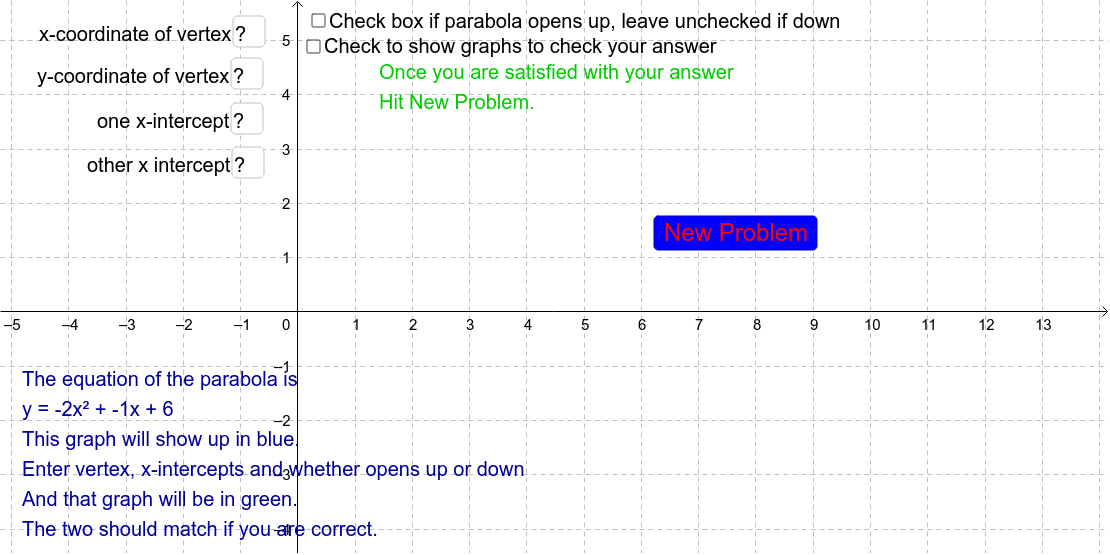
This example demonstrates the properties of quadratic functions and parabolas. Key mathematical concepts include quadratic functions, the vertex and axis of symmetry of a parabola. Using GeoGebra commands such as RandomElement, Textfield, and LaTeX, the example dynamically shows the transformations of quadratic function graphs. Suitable for high school mathematics education and learning.
GeoGebra Commands & Parameters
RandomElement({-4, -3, -2, -1, 2, 3, 4, 5}) → A5RandomElement({-2, -1, 1, 2}) → A3RandomElement({-4, -3, -2, -1, 2, 3, 4, 5}) → A4RandomElement({-4, -3, -2, -1, 0, 1, 2, 3, 4}) → A1RandomElement({-4, -3, -2, -1, 0, 1, 2, 3, 4}) → A2Textfield(h) → inputBox1Textfield(k) → inputBox2Textfield(x1) → inputBox3Textfield(x2) → inputBox4LaTeX(f, true, true) → text3
AI Drawing Prompt Reference
Create a dynamic illustration showing properties of quadratic functions and parabolas, including randomly generated vertices and axes of symmetry, with the function expression labeled, suitable for high school mathematics education.
The prompt above was compiled from the original drawing commands and is for reference only.