
Quadratic Translations: Visualizing Parabola Shifts
Loading the math board and drawing, please wait…
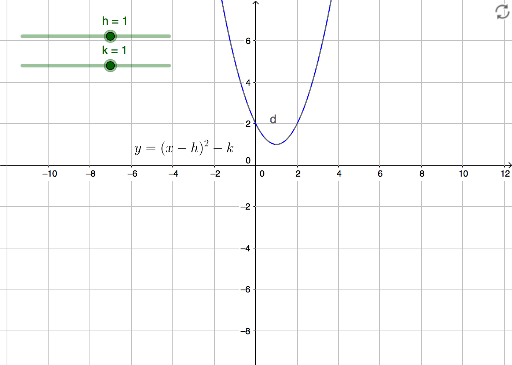
① This example dynamically demonstrates how a quadratic function's graph translates horizontally and vertically in the coordinate plane, showing the parabola moving as a whole. ② The core mathematical concept is the translation transformation of function graphs, focusing on how parameters h and k in the vertex form y = a(x-h)² + k shift the parabola's position while preserving its shape. ③ Construction highlights: based on the summary, sliders or variables h and k control the translation amounts, c and d likely represent the original and translated quadratic curves, and text1 displays the current function expression or vertex coordinates, leveraging GeoGebra's dynamic algebra and graphics views. ④ Suitable for middle-to-high school students learning quadratic functions, as well as teachers for classroom demonstrations or students for self-guided exploration of translation rules.
GeoGebra Commands & Parameters
Numeric h(1)Numeric k(1)y = (x - h)^(2) + ky = (x - 1)^(2) + 1
AI Drawing Prompt Reference
Draw a coordinate plane with a parabola whose vertex is at (h, k), where h and k are controlled by two sliders, both initially set to 1. The parabola has the equation y = (x - h)² + k, opening upward. Also draw a reference parabola y = (x - 1)² + 1 with vertex at (1,1) to compare shifts. Include axes, grid lines, and a text label showing the current function expression or vertex coordinates. As the sliders move, the main parabola translates as a whole without changing shape, while the reference parabola stays fixed, visually demonstrating horizontal and vertical translations of the quadratic graph.
The prompt above was compiled from the original drawing commands and is for reference only.