
Quadratic Transformations: Effects of Parameters a, h, k on Parabolas
Loading the math board and drawing, please wait…
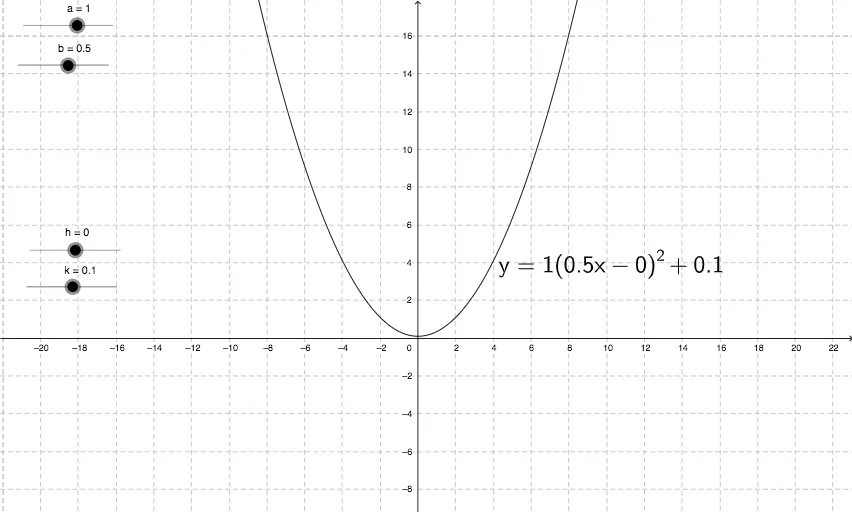
①This example dynamically demonstrates how changing parameters a, h, and k in the vertex form y=a(x-h)²+k transforms the graph of a quadratic function, including vertical stretch/compression, reflection, horizontal shift, and vertical shift. ②Core mathematical concepts include the vertex form of quadratic functions, graph transformations, symmetry axis, and vertex coordinates. ③Construction details: GeoGebra sliders a, h, and k are used to control parameters; the quadratic function object b is defined; text1 displays the current function expression; an auxiliary line segment c may mark the axis of symmetry or vertex. Users drag sliders to observe real-time changes in the parabola. ④Suitable for middle and high school students learning quadratic function properties, and useful for classroom demonstrations or self-exploration to understand parameter effects on graphs.
GeoGebra Commands & Parameters
Numeric a(1)Numeric h(0)Numeric k(0.1)Numeric b(0.5)y = (a * ((b * x) - h)^(2)) + k
AI Drawing Prompt Reference
Draw a parabola graph where three sliders control parameters a, h, and k to demonstrate their effects on the vertex form y=a(x-h)²+k, including vertical stretch/compression, reflection, horizontal/vertical shifts. Show the current function expression and use an auxiliary line to mark the axis of symmetry or vertex, allowing users to observe real-time changes by dragging the sliders.
The prompt above was compiled from the original drawing commands and is for reference only.