
Quadratic Roots and Parabola Graph: Interactive Nature of Solutions
Loading the math board and drawing, please wait…
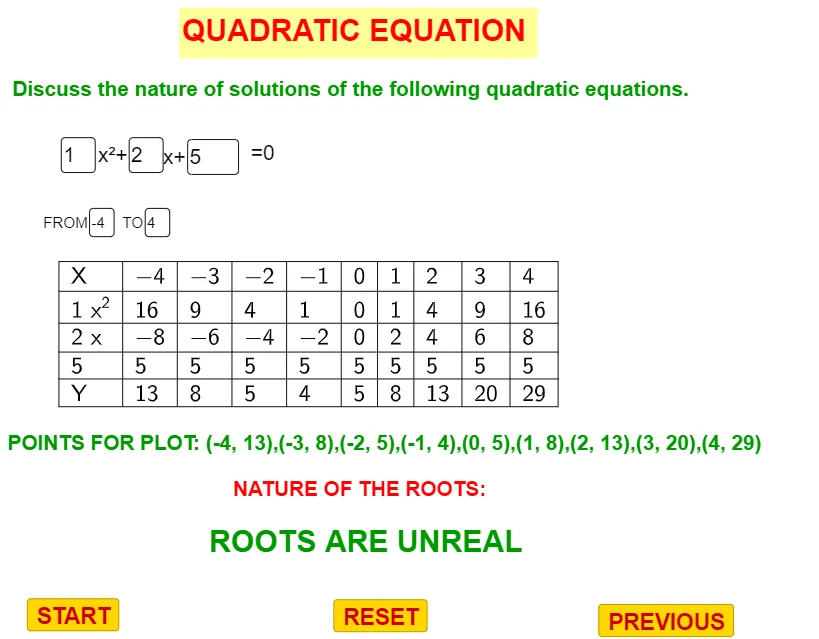
This example demonstrates how the nature of solutions of a quadratic equation ax^2+bx+c=0 corresponds to the graph of a parabola. It visually links the discriminant Δ=b^2−4ac to root types: Δ>0 (two distinct real roots), Δ=0 (one repeated root), and Δ<0 (no real roots). The key math concepts include quadratic equations, discriminant-based classification, the relation between x-intercepts and real roots, and the geometric meaning of a quadratic function’s opening direction and intercept structure. Construction-wise, the design relies on GeoGebra tools such as Textfield and InputBox objects to enter parameters (a, b, c and related values), uses Sum and If to compute/compare expressions involving Δ and select the correct case, and outputs the results via TableText. Named text objects (e.g., text1) and table entries (multiple labeled cells) support synchronized explanations alongside the plotted diagram. Suitable for middle and high school students, classroom interactive lessons, and exam preparation focused on translating algebraic conditions into graph features.
GeoGebra Commands & Parameters
Textfield(a) → InputBox1Textfield(b) → InputBox2Textfield(c) → InputBox3Textfield(m) → InputBox4Textfield(n) → InputBox5Sum(B4:B6) → B7Sum(C4:C6) → C7Sum(D4:D6) → D7Sum(E4:E6) → E7Sum(F4:F6) → F7Sum(G4:G6) → G7Sum(H4:H6) → H7Sum(I4:I6) → I7Sum(J4:J6) → J7If(w > A10, (("" * A3) * "")) → A17_{1}If(w > A10, (("" * A3) * "")) → A17If(w > B10, (("" * B3) * "")) → B17If(w > C10, (("" * C3) * "")) → C17If(w > D10, (("" * D3) * "")) → D17If(w > E10, (("" * E3) * "")) → E17If(w > F10, (("" * F3) * "")) → F17If(w > G10, (("" * G3) * "")) → G17If(w > H10, (("" * H3) * "")) → H17If(w > I10, (("" * I3) * "")) → I17If(w > A11, (("" * A4) * "")) → A18If(w > A12, (("" * A5) * "")) → A19If(w > A13, (("" * A6) * "")) → A20If(w > A14, (("" * A7) * "")) → A21If(w > B11, (("" * B4) * "")) → B18If(w > C11, (("" * C4) * "")) → C18If(w > D11, (("" * D4) * "")) → D18If(w > E11, (("" * E4) * "")) → E18If(w > F11, (("" * F4) * "")) → F18If(w > G11, (("" * G4) * "")) → G18If(w > H11, (("" * H4) * "")) → H18If(w > I11, (("" * I4) * "")) → I18If(w > B12, (("" * B5) * "")) → B19If(w > C12, (("" * C5) * "")) → C19If(w > D12, (("" * D5) * "")) → D19If(w > E12, (("" * E5) * "")) → E19If(w > F12, (("" * F5) * "")) → F19If(w > G12, (("" * G5) * "")) → G19If(w > H12, (("" * H5) * "")) → H19If(w > I12, (("" * I5) * "")) → I19If(w > B13, (("" * B6) * "")) → B20If(w > C13, (("" * C6) * "")) → C20If(w > D13, (("" * D6) * "")) → D20If(w > E13, (("" * E6) * "")) → E20If(w > F13, (("" * F6) * "")) → F20If(w > G13, (("" * G6) * "")) → G20If(w > H13, (("" * H6) * "")) → H20If(w > I13, (("" * I6) * "")) → I20If(w > B14, (("" * B7) * "")) → B21If(w > C14, (("" * C7) * "")) → C21If(w > D14, (("" * D7) * "")) → D21If(w > E14, (("" * E7) * "")) → E21If(w > F14, (("" * F7) * "")) → F21If(w > G14, (("" * G7) * "")) → G21If(w > H14, (("" * H7) * "")) → H21If(w > I14, (("" * I7) * "")) → I21If(w > J10, (("" * J3) * "")) → J17If(w > J11, (("" * J4) * "")) → J18If(w > J12, (("" * J5) * "")) → J19If(w > J13, (("" * J6) * "")) → J20If(w > J14, (("" * J7) * "")) → J21If(w > A24, (("" * A3) * "")) → A27If(w > B24, (("" * B3) * "")) → B27If(w > C24, (("" * C3) * "")) → C27If(w > D24, (("" * D3) * "")) → D27If(w > E24, (("" * E3) * "")) → E27If(w > F24, (("" * F3) * "")) → F27If(w > G24, (("" * G3) * "")) → G27If(w > H24, (("" * H3) * "")) → H27If(w > I24, (("" * I3) * "")) → I27If(w > J24, (("" * J3) * "")) → J27If(w > A25, (("" * A7) * "")) → A28If(w > B25, (("" * B7) * "")) → B28If(w > C25, (("" * C7) * "")) → C28If(w > D25, (("" * D7) * "")) → D28If(w > E25, (("" * E7) * "")) → E28If(w > F25, (("" * F7) * "")) → F28If(w > G25, (("" * G7) * "")) → G28If(w > H25, (("" * H7) * "")) → H28If(w > I25, (("" * I7) * "")) → I28If(w > J25, (("" * J7) * "")) → J28TableText({{A17, B17, C17, D17, E17, F17, G17, H17, I17, J17}, {A18, B18, C18, D18, E18, F18, G18, H18, I18, J18}, {A19, B19, C19, D19, E19, F19, G19, H19, I19, J19}, {A20, B20, C20, D20, E20, F20, G20, H20, I20, J20}, {A21, B21, C21, D21, E21, F21, G21, H21, I21, J21}}, "|_llllllllll") → text2If(d ≟ 0, "ROOTS ARE REAL AND EQUAL", If[d < 0, "ROOTS ARE UNREAL", If[d > 0, "ROOTS ARE REAL AND DISTINCT"]]) → text6
AI Drawing Prompt Reference
Draw a parabola graph given by y = ax^2 + bx + c. Include a discriminant calculation Δ = b^2 - 4ac. Display text explanations based on Δ: if Δ > 0, show "two distinct real roots"; if Δ = 0, show "one repeated root"; if Δ < 0, show "no real roots". The construction order should be: input parameters a, b, c; compute Δ; then display the appropriate text based on Δ's value. The graph should clearly illustrate the relationship between the parabola and the roots.
The prompt above was compiled from the original drawing commands and is for reference only.