
Quadratic Inequality System
Loading the math board and drawing, please wait…
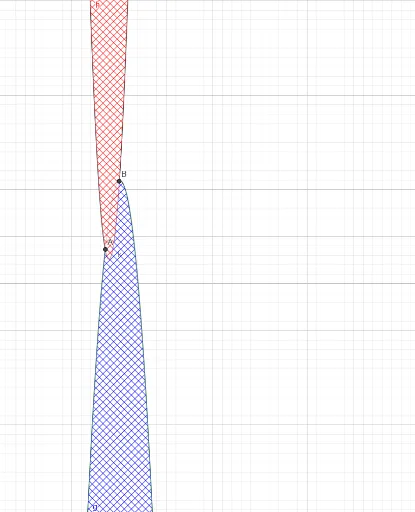
This example demonstrates the graphical representation of a system of quadratic inequalities. Key mathematical concepts include quadratic inequalities, intersections, and region division. Using the Intersect command and Textfield objects, users can dynamically adjust the coefficients of the inequalities and observe changes in the solution set. Suitable for high school mathematics education and learning.
GeoGebra Commands & Parameters
Intersect(p, k) → A, BTextfield(a) → kotakmasukan1Textfield(b) → kotakmasukan2
AI Drawing Prompt Reference
Draw a coordinate plane with two parabolas intersecting at two points. Shade the common region that satisfies both quadratic inequalities, representing the solution set. Place two input boxes nearby to adjust the coefficients of the parabolas, so that the intersection points and shaded area update dynamically. The graph is designed for exploring systems of quadratic inequalities in an educational context.
The prompt above was compiled from the original drawing commands and is for reference only.