
Quadratic Inequalities Demo by Mr Hardman
Loading the math board and drawing, please wait…
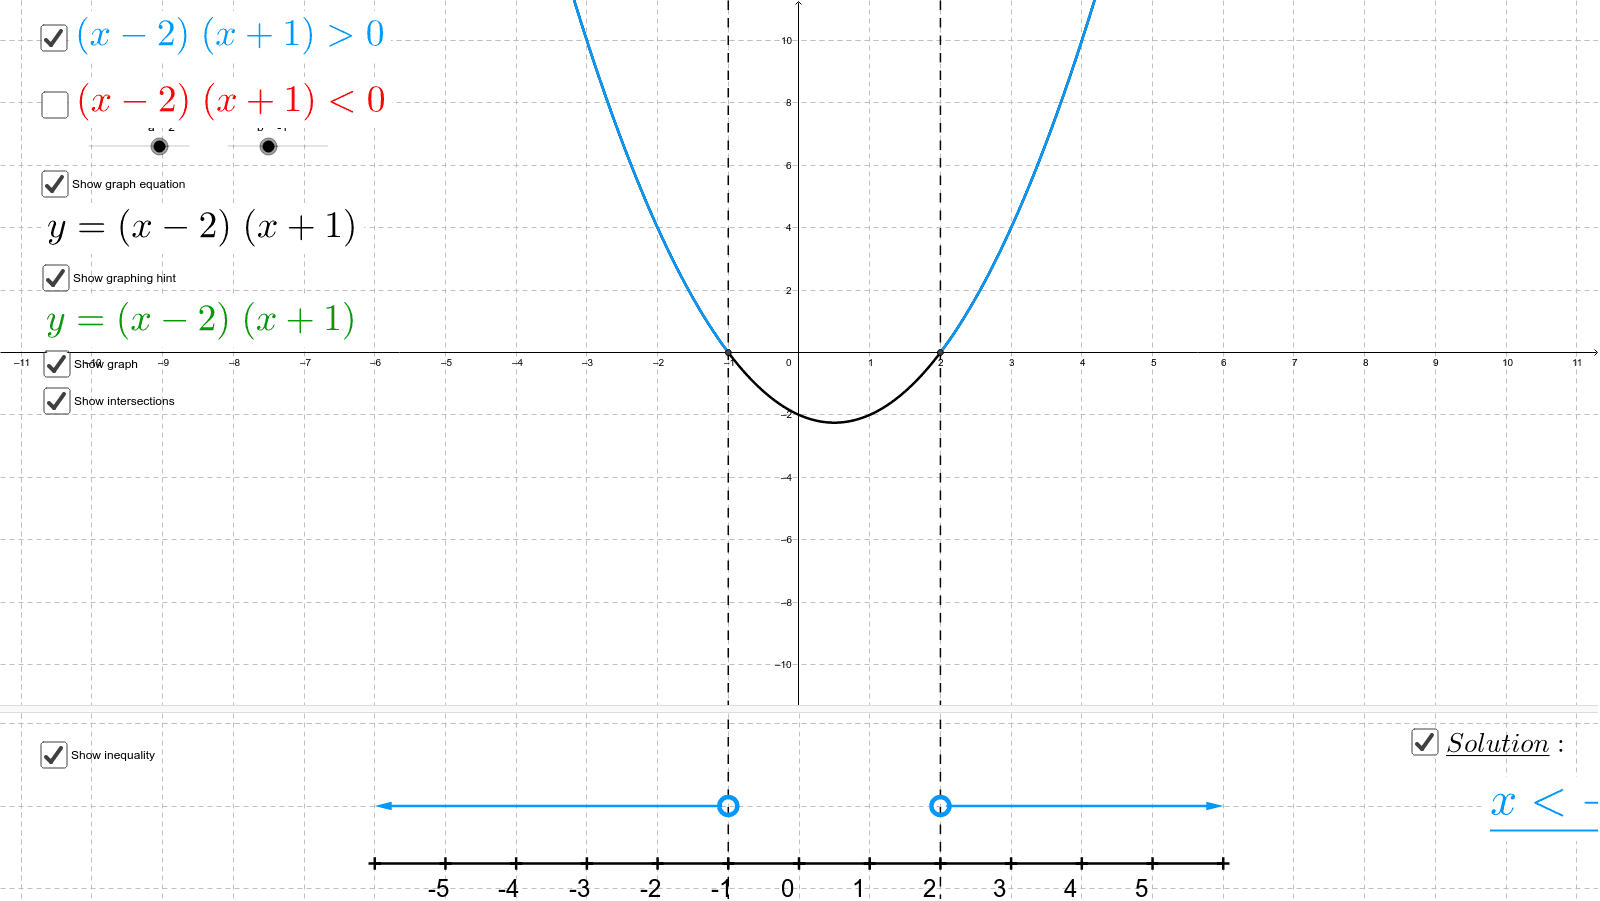
This example demonstrates the solution set of quadratic inequalities in the coordinate system. It involves core mathematical concepts such as quadratic functions, inequality solving, and function graph transformations. Construction highlights include using GeoGebra commands like Expand, Intersect, Segment, Sequence, Vector, OrthogonalLine, and Point, with objects like a, b, f, g, B, H, A, G, text1, text2, c, d, e, k, l, C, D, m, list1, list2, K, L, M, u, N, v, O, P, q, h, r, i, E, F, text8, text9, j, text7, scale, I. It is suitable for high school mathematics teaching, helping students visually understand the geometric meaning and solution methods of quadratic inequalities
GeoGebra Commands & Parameters
Expand(f) → gIntersect(g, xAxis, 2) → BIntersect(g, xAxis, 1) → ASegment(C, D) → mSequence(((AxisStepX[] * i), (-7)), i, -5, 5) → list1Sequence(Text[x(Element[list1, i]), Element[list1, i] + (0, (-0.5))], i, 1, 11) → list2Vector(M, K) → uVector(N, L) → vSegment(O, P) → qOrthogonalLine(A, xAxis) → nOrthogonalLine(B, xAxis) → pPoint(n) → QPoint(p) → RSequence(Text[x(Element[list1, i]), Element[list1, i] + ((-0.25), (-4))], i, 1, 11) → list3
AI Drawing Prompt Reference
Draw the graph of a quadratic function in the coordinate system and demonstrate its solution set for inequalities. First, plot the x-axis and the quadratic function. Then, find the intersection points of the function with the x-axis and connect them. Next, generate a series of points on the x-axis and label their coordinates. Finally, draw two perpendicular lines to the x-axis through the intersection points, and label the coordinates on these lines.
The prompt above was compiled from the original drawing commands and is for reference only.