
Quadratic Function: Standard Form vs. Graphing Form
Loading the math board and drawing, please wait…
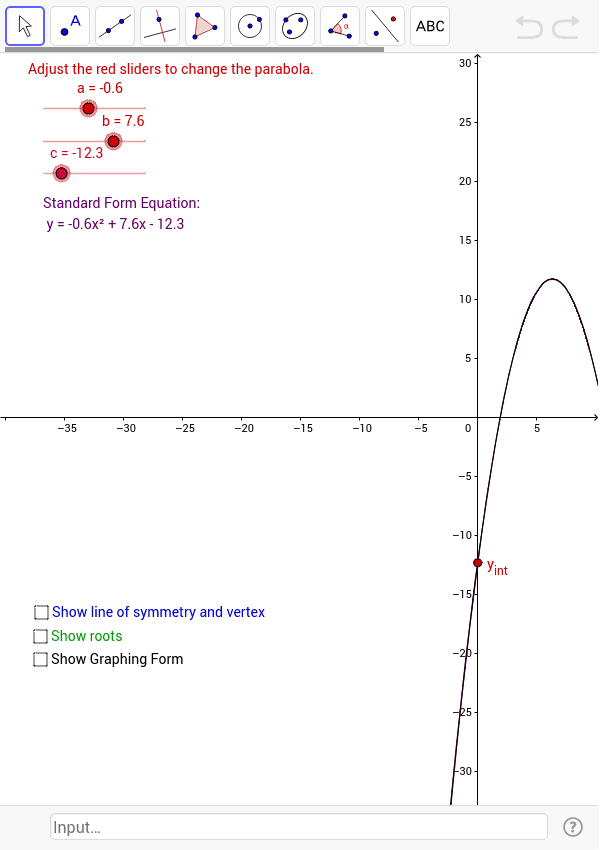
① This example demonstrates how the graph of a quadratic function changes between standard form (ax²+bx+c) and vertex (graphing) form a(x-h)²+k, showing dynamic updates of the parabola's vertex, intercepts, and axis of symmetry as coefficients vary. ② Core mathematical concepts include conversion between standard and vertex forms, vertex coordinates, y‑intercept, axis of symmetry, discriminant, and the geometric meaning of roots. ③ Construction highlights: the Intersect command finds intersections of the curve with axes; objects such as vertex, vertex_x, vertex_y, y_int, Quad1, and auxiliary points c, a, b, R_1, R_2, c_1, d, e, f, g, h are created, with text labels text1, text2, text3 displaying parameters and coordinates in real time. ④ Suitable for high‑school quadratic function lessons, student inquiry, exam review, and introductory analytic geometry at the college preparatory level.
GeoGebra Commands & Parameters
Intersect(Quad1, xAxis) → R_2, R_1Intersect(Quad1, c_1) → vertex,