
Quadratic Function Graphing and Properties
Loading the math board and drawing, please wait…
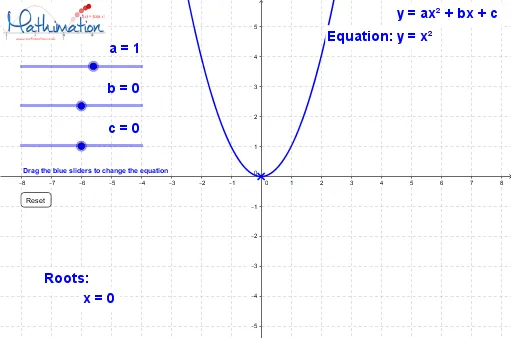
This example demonstrates the graphing of quadratic functions and their relationship with parabolas. Key math concepts include quadratic functions, parabolas, standard deviation, polygons, and triangles. Construction highlights involve using the Intersect command to find intersection points, Slider Animation to show parameter variations, and Coordinate Geometry to analyze graph properties. Suitable for high school mathematics teaching on function graphing and property exploration.
GeoGebra Commands & Parameters
Intersect(Parabola, xAxis, 2) → AIntersect(Parabola, xAxis, 1) → B
AI Drawing Prompt Reference
Graph a quadratic function and show its relationship with a parabola. Mark two intersection points on the x-axis and use animation to demonstrate how parameter variations affect the function's graph. Analyze the coordinate geometry properties of the graph and display relevant polygons and triangles.
The prompt above was compiled from the original drawing commands and is for reference only.