
Quadratic Function Graph Demo by Janelle Grube
Loading the math board and drawing, please wait…
In collections
Graphing quadratic equations
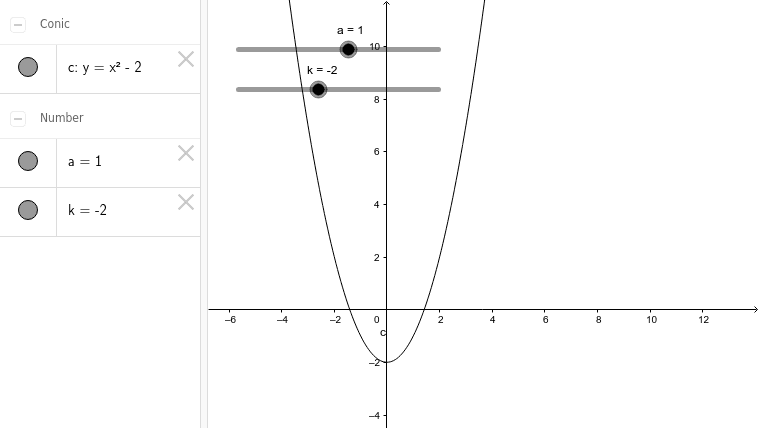
This example demonstrates the graph of the quadratic function y=ax^2+k, showing how parameters a and k affect the graph's shape and position. Key math concepts include quadratic functions, the impact of parameters on graph orientation and translation, and symmetry. Constructed using GeoGebra commands/objects a, k, c for dynamic visualization. Suitable for high school students learning function transformations and parameter effects, ideal for classroom instruction or homework practice.
GeoGebra Commands & Parameters
Numeric a(1.0)Numeric k(-2.0)y = (a * x^(2)) + k
AI Drawing Prompt Reference
Draw the graph of the quadratic function y=ax^2+k with parameters a and k set to 1 and -2 respectively, showing how these parameters affect the graph's shape and position, including the orientation of the parabola, the vertex position, and the axis of symmetry, suitable for high school students learning function transformations and parameter effects.
The prompt above was compiled from the original drawing commands and is for reference only.