
Quadratic Function Graph Demo by Dr. Doug Davis, 3D
Loading the math board and drawing, please wait…
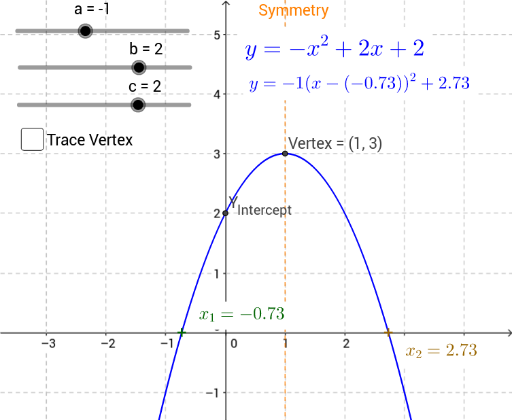
This example demonstrates how to graph and analyze quadratic functions using GeoGebra. It illustrates the relationship between a parabola and its quadratic equation, and helps understand core concepts like symmetry by tracing key points such as the vertex, y-intercept, and intersection points. GeoGebra commands like Intersect and OrthogonalLine, along with objects like a, b, c, d, are used to construct elements like the vertex and x-intercepts. Suitable for high school mathematics education to visualize properties and transformations of quadratic functions.
GeoGebra Commands & Parameters
Intersect(d, xAxis) → x_1, x_2OrthogonalLine(Vertex, xAxis) → Symmetry