
Quadratic Function Graph and Tangent Line
Loading the math board and drawing, please wait…
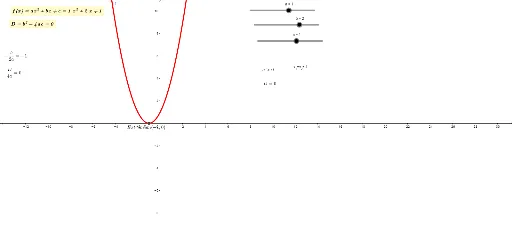
This example demonstrates the graphing of a quadratic function and its tangent line, focusing on key mathematical concepts such as quadratic functions, derivatives, tangent lines, and extrema. The construction utilizes GeoGebra commands like Extremum to find extrema and Intersect to determine intersection points, with objects including parameters a, b, c, function f, extremum point E, and intersection points X_1, X_2. It is suitable for high school mathematics education to illustrate the local properties of function graphs and the geometric meaning of derivatives.
GeoGebra Commands & Parameters
Extremum(f) → EIntersect(f, xAxis) → X_1, X_2
AI Drawing Prompt Reference
Draw a quadratic function graph and find its extremum point. Then, determine the intersection points of the quadratic function with the x-axis. The quadratic function graph should show its direction, vertex position, and the points where it intersects the x-axis.
The prompt above was compiled from the original drawing commands and is for reference only.