
Quadratic Function Graph Analysis Example by Walch Education
Loading the math board and drawing, please wait…
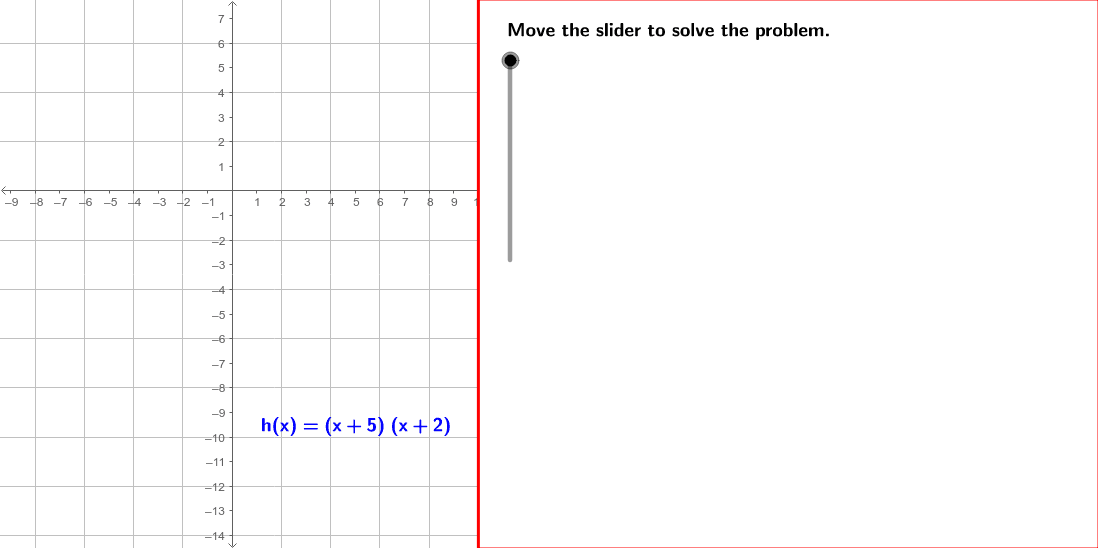
This example demonstrates how to graph and analyze the quadratic function f(x) = (x + 5)(x + 2) using GeoGebra. Key math concepts include x-intercepts, axis of symmetry, vertex, factoring, and coordinate geometry. Construction highlights from the summary involve commands like If, Factors, Polygon, TableText, and objects such as root1, root2, SymLine. Suitable for high school mathematics education to understand quadratic function graphs and geometric properties.
GeoGebra Commands & Parameters
If(abs(a) ≟ 1, If[a ≟ 1, ha, (-ha(x))], h) → h1Factors(h) → factorshIf(abs(a) ≟ 1, If[a ≟ 1, "", "-"], LaTeX[a]) → a1If(abs(a_1) ≟ 1, If[a_1 ≟ 1, ha_1, (-ha_1(x))], h_1) → h1_1Factors(h_1) → factorsh_1Polygon((edge, y(Corner[1])), Corner[2], Corner[3], (edge, y(Corner[4]))) → Mask, b, c, d, eTableText({{"\textit{f}(\textit{x})=" + (LaTeX[h1]), "\text{Original equation}"}, {" 0=" + (LaTeX[h1]), "\text{Set the equation equal to 0}."}, {" 0=" + (LaTeX[factor1]) + "\text{ or }0=" + (LaTeX[factor2]), "\text{Set each factor equal to 0.}"}, {"\textcolor{Brown}{" + (LaTeX[root1]) + "}=x\text{ or }\textcolor{Brown}{" + (LaTeX[root2]) + "}=x", "\text{Solve each equation for }\textit{x}. "}}, "l") → Conclusion1TableText({{"\textit{f}(\textit{x})=" + (LaTeX[h1]), "\text{Original equation}"}, {"\textit{f}(" + (LaTeX[rootav]) + ")=" + (LaTeX[a1]) + "(" + (LaTeX[rootav]) + "" + (LaTeX[Element[plus, sgn((-root1)) + 2]]) + "" + (LaTeX[(-root1)]) + ") (" + (LaTeX[rootav]) + " " + (LaTeX[Element[plus, sgn((-root2)) + 2]]) + "" + (LaTeX[(-root2)]) + ")", "\text{Substitute }\textcolor{magenta}{ " + (LaTeX[rootav]) + "}\text{ for }\textit{x}."}, {"\textit{f}(" + (LaTeX[rootav]) + ")=" + (LaTeX[a1]) + "(" + (LaTeX[factor1(rootav)]) + ")(" + (LaTeX[factor2(rootav)]) + ")", "\text{Simplify.}"}}, "l") → Conclusion3b
AI Drawing Prompt Reference
Graph the quadratic function f(x) = (x + 5)(x + 2), highlighting x-intercepts, axis of symmetry, and vertex. Show the factoring process and coordinate geometry. Start by plotting the function, then mark the x-intercepts, draw the axis of symmetry, and label the vertex. Include text explaining the factoring steps, how to set the function to zero to find the x-intercepts, and verify the function value at the vertex.
The prompt above was compiled from the original drawing commands and is for reference only.