
Quadratic Function Example
Loading the math board and drawing, please wait…
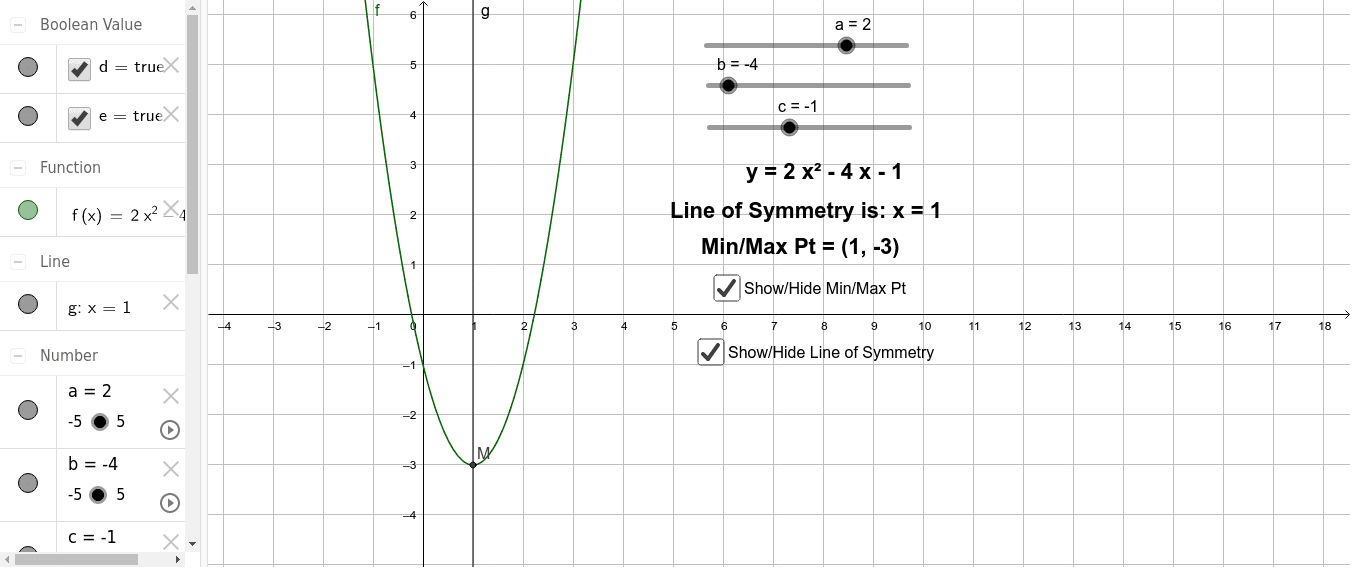
This example demonstrates the graph of a quadratic function and its relationship with coefficients a, b, and c. Core math concepts include quadratic functions, vertex, axis of symmetry, and discriminant. Construction highlights: sliders a, b, c control function parameters, f represents the function graph, x1, y1 denote the vertex, M indicates the focus, g shows the axis of symmetry, text1, text2, text3 display function expressions and vertex coordinates, while d, e assist in constructions. Suitable for high school mathematics education to understand quadratic function properties and parameter effects.
GeoGebra Commands & Parameters
Numeric a(2.0)Numeric b(-4.0)Numeric c(-1.0)f(x) = (a * x^(2)) + (b * x) + c((-b)) / ((2 * a))f(x1)(x1, y1)x = x1Boolean d(true)Boolean e(true)
AI Drawing Prompt Reference
Draw the graph of a quadratic function with adjustable coefficients a, b, and c using sliders. Show the vertex, axis of symmetry, and focus. Label the vertex coordinates and draw the axis of symmetry. Add text to display the function expressions and vertex coordinates, and use helper objects for construction.
The prompt above was compiled from the original drawing commands and is for reference only.