
Rectangle Sum
Loading the math board and drawing, please wait…
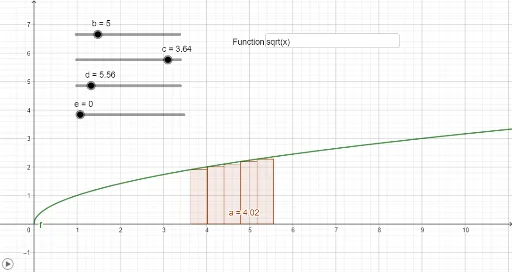
This example demonstrates the process of summing rectangles. It involves geometric, exponential, and geometric distribution concepts. Using GeoGebra commands such as RectangleSum and Textfield, dynamic changes in rectangles can be constructed. Suitable for high school mathematics education and learning, particularly in geometric construction and function graphing.
GeoGebra Commands & Parameters
RectangleSum(f, c, d, b, e) → aTextfield(f) → InputBox1
AI Drawing Prompt Reference
Draw a function graph by approximating it with the sum of rectangles. First, set a parameter as the base length of the rectangles, then draw a series of rectangles based on this parameter and the function expression. Finally, approximate the function graph with the sum of the rectangles' areas. Use a slider to adjust the number of rectangles and observe the approximation effect.
The prompt above was compiled from the original drawing commands and is for reference only.